
Study on the Underclassification of Children Eligible for Instruction in the Minority Official Language in the 2021 Census
Release date: March 26, 2024
Skip to text
Text begins
1. Introduction
In 2021, the Canadian Census of Population included new questions on language of instruction. The purpose of these new questions was to determine the number of children eligible for instruction in the minority official language (i.e., English in Quebec and French in Canada outside Quebec), in accordance with the provisions of section 23 of the Canadian Charter of Rights and Freedoms. To do this, the responses to the new questions were combined with the responses on first language learned and still understood (mother tongue) and with information on the relationships between the people living in the same household, because eligibility for instruction in the minority official language depends not only on children’s characteristics, but also on the characteristics of their parents and siblings.Note 1
The results, which were published in November 2022, showed that almost 900,000 children living in private households in Canada in 2021 were eligible for instruction in the minority official language.Note 2 However, these data—the most complete and detailed produced to date—had some limitations, one of which being that family ties between people could be established only for those who lived in the same household. As a result, children may have been classified as ineligible for instruction in the minority official language whereas they would have been considered eligible if it had been possible to link them with their parents and siblings who were not living with them.
This methodology report presents the results of an analysis to estimate the number of children in this situation. To do this, the 2021 Census was linked to other data sources (past censuses and administrative data) to find other family members of the children enumerated in 2021 and determine which of these children could be added to the Census of Population figure.
The first part of this report describes the data sources, while the second examines the concepts and definitions. This is followed by a presentation of the methods used to estimate the number and rate of children to reclassify. These numbers and rates are given in the next section of this report, which presents the main findings of the analysis by selected region and age group. Detailed results can be found in Appendix A.
2. Data sources
To determine the number of additional children eligible for instruction in the minority official language of their province, three sources of data were integrated through linkage processes (see Section 4—Methods).
The first data source is composed of data from the 2021 Census short-form questionnaire, from which the necessary demographic, family and language information for the population of interest is obtained. Some 2021 Census variables are required for the linkage process, while others are required to assign the eligibility criteria after linkage.
The second data source is a combined administrative data source comprising administrative records that have been previously integrated in Statistics Canada’s Social Data Linkage Environment (SDLE) or linked to the Canadian Statistical Demographic Database, the latter being an administrative data file used for research. These records, some of which are available on an annual basis, come from the vital statistics records (birth records) of Canadian provinces and territories and from federal tax records (T1 Income Tax Return, T4 Statement of Remuneration, Canadian Child Benefit, etc.). This combined data source makes it possible to obtain links between individuals who have a parent–child relationship and between individuals who have been in a spousal relationship.
The third data source is composed of past censuses. In this study, the 2011 and 2016 censuses are used to find parents and children who were living in the same household by examining the relationships between individuals for these specific census years.
3. Concepts and definitions
This report examines children eligible for instruction in the minority official language (i.e., French in Canada outside Quebec and English in Quebec) at the primary and secondary levels. Eligibility for instruction in the minority official language is defined according to the criteria in subsections 23(1) and 23(2) of the Canadian Charter of Rights and Freedoms, which read as follows:
“Language of instruction
23 (1) Citizens of Canada
(a) whose first language learned and still understood is that of the English or French linguistic minority population of the province in which they reside, or
(b) who have received their primary school instruction in Canada in English or French and reside in a province where the language in which they received that instruction is the language of the English or French linguistic minority population of the province,
have the right to have their children receive primary and secondary school instruction in that language in that province.
Continuity of language instruction
(2) Citizens of Canada of whom any child has received or is receiving primary or secondary school instruction in English or French in Canada, have the right to have all their children receive primary and secondary school instruction in the same language.”
These criteria are in force for all provinces and territories in Canada, with the exception of the criterion stated in paragraph 23(1)(a), which does not apply to Quebec.Note 3
3.1 2021 Census concepts
In the context of the 2021 Census,Note 4 calculating the number of children eligible for instruction in the minority official language based on the criteria in the charter required the information collected on age, place of residence, relationships between people in the household, mother tongue, and primary and secondary school instruction in the minority official language. The counts published in 2022 on the number of eligible children are from the census short-form questionnaire, which does not include a question on citizenship. Therefore, these counts, as well as those in this report, do not factor in citizenship.Note 5
The children who were considered eligible for instruction in the minority official language are those living in a private household at the time of the 2021 Census and who were in at least one of the following situations:
- They were living in Canada outside Quebec with a parent whose mother tongue is French (paragraph 23[1][a]—this paragraph does not apply to Quebec).
- They were living with a parent who completed at least one year of primary school instruction in English for residents of Quebec or in FrenchNote 6 for residents of Canada outside Quebec (paragraph 23[1][b]).
- They were living with a sibling who completed at least one year of primary or secondary school instruction in English for residents of Quebec or in French for residents of Canada outside Quebec (subsection 23[2]).
- They themselves (the children) completed at least one year of primary or secondary school instruction in English for residents of Quebec or in French for residents of Canada outside Quebec (subsection 23[2]).
In the 2021 Census analytical products on eligibility for instruction in the minority official language, children are defined as people who were under 18 years of age on December 31, 2020. Their parents and siblings were found using respondents’ answers to census questions about members of their household.
Parent–child relationships considered for the application of the charter criteria match those reported by census respondents. For example, if Person 1 reported on the census questionnaire that Person 2 is their spouse and Person 3 is Person 1’s child only, then only Person 1 was considered to be Person 3’s parent. Likewise, only people with at least one parent in common were considered to be siblings. If, in the previous example, Person 4 was added but is not one of Person 1’s children, then Person 4 would not have been considered to be Person 3’s sibling. This means that children living in a blended family were not automatically considered to be the children of both spouses. They were only considered so if this was clearly indicated in the questionnaire.
Note that the concept of child is not defined in the census other than by the concepts of “son” or “daughter,” which are relationship options provided in the questionnaire. They could be biological or adopted children, without it being possible to differentiate between the two.
Start of text boxPlace of residence of parents and siblings, as well as eligibility
The main limitation of the census data related to the eligibility for instruction in the minority official language comes from the fact that not all children live with both parents or all of their siblings, whereas the application of the criteria in the charter assumes that information is available on them. Therefore, some children may have been incorrectly classified in the 2021 Census as ineligible for instruction in the minority official language based on the information available. For example, a child lives alone with their mother, and neither meets the criteria in the charter, but the child has a father who meets one of the criteria and lives in another household. In such a case, the census data cannot be used to link this child to their father. It is precisely to work around this limitation that the project in this report was carried out.
3.2 Differences between the concepts in the 2021 Census and the other data sources used
Some of the data sources used in this study differ from the 2021 Census in terms of the way they define parents and children, limiting the analysis here.
For the 2016 and 2011 censuses, the definition of family relationships in these sources is the same as that in the 2021 Census, the questionnaire having remained unchanged in this regard since 2011. The limits related to the fact that family relationships between people can be established only for those who lived in the same household are also present in the 2011 and 2016 censuses. If a parent already lived outside the household in which their child lived at the time of these censuses, these data sources will not help to link them to their child.
For the administrative data, which combine several data sources, the vital statistics data have a more restrictive definition of what a parent is compared with the census. The vital statistics forms include the father’s and mother’s names and are, in the vast majority of cases, completed immediately after the child’s birth. Thus, the parents indicated on these forms are, most of the time, children’s biological parents, whereas the parents reported in the census may be adoptive parents.
Conversely, the tax data, also included in the administrative data, present a wider definition of parent–child relationships. The information available through tax data relates to “dependent” children—thus, children under the filer’s responsibility from a tax perspective. Dependent children can include biological children, adopted children or stepchildren, or, in other words, the spouse’s children. The latter—the stepchildren—are not considered when applying the eligibility criteria in the census.
Because of these conceptual differences, this study gives precedence, where possible, to the data sources that are conceptually the most similar to the 2021 Census i.e., the 2016 and 2011 censuses, followed by vital statistics data (see next section).
4. Methods
The methods used in this study consist in linking people from the same family who, at the time of the 2021 Census, did not live together, to then determine the number of children who would have been considered eligible if these relationships could have been identified in the census. To link people, matching between the 2021 Census and the other sources described above was necessary. In the case of children who were not classified as eligible at the time of the 2021 Census, the primary objective of matching to these other sources was to find their parents and siblings not living in the same household in 2021. Then, these parents’ and siblings’ responses to the mother tongue and language of instruction questions in the 2021 Census were considered to find the enumerated children who should have been considered eligible.
Start of text boxUnderclassification and undercoverage
The objective of this study is related to classification of children, not their enumeration. The purpose of census coverage studies is to evaluate the number of people who should have been enumerated but were not (undercoverage), and the number of people in more than one questionnaire in a given census (overcoverage). These studies can potentially add to or subtract from the number of people in the population.
This study does not add anyone to or subtract anyone from the total Canadian population count. Instead, it estimates the number of children enumerated in 2021 who were incorrectly classified as ineligible for instruction in the minority official language. The estimates in this report are therefore separate from (and complementary to) those in the 2021 Census coverage studies.
For more information on census coverage, consult the Coverage Technical Report, Census of Population, 2016.Note 7
4.1 Overview of linkages
The 2021 Census was linked to past censuses and to the combined administrative source using distinct processes in Statistics Canada’s SDLE. These processes leveraged reliable information from linked fields and used proven linkage techniques. It is worth noting that no new linkages were performed for the current study; instead, linkage keys previously created to meet other 2021 Census needs were used.Note 8
The quality of the results of this study is highly dependent on the linkage rates between the 2021 Census and the other sources used. Although the demographic of interest is children, this study required the linkage of all residents of Canada younger than 30 years of age. Linkage rates for the population younger than 30 on December 31, 2020, are presented in Table 1 and Table 2 by age group, region (Canada outside Quebec and Quebec) and data source.
| Age group | Combined administrative file | Past censuses | Either or both sources |
|---|---|---|---|
| percent | |||
| Total | 88.00 | 70.29 | 88.99 |
| 0 to 4 years | 83.12 | 0.31Table 1 Note 1 | 83.15 |
| 5 to 11 years | 92.37 | 76.06 | 92.79 |
| 12 to 17 years | 91.23 | 87.48 | 92.39 |
| 18 years and older | 85.39 | 78.27 | 86.86 |
|
|||
| Geography | Combined administrative file | Past censuses | Either or both sources |
|---|---|---|---|
| percent | |||
| Total | 88.00 | 70.29 | 88.99 |
| Quebec | 87.22 | 70.49 | 88.03 |
| Canada outside Quebec | 88.22 | 70.23 | 89.26 |
| Sources: Statistics Canada, Census of Population, 2021 and Study on the underclassification of children eligible for instruction in the minority official language in the 2021 Census. | |||
4.2 Methodological approaches
In the first step of the methodological approach, all residents of Canada younger than 30 in the 2021 Census were distributed into groups based on their family status to determine which additional steps would be required to establish the family relationships (see explanations and figures 1 to 3 below). The age of 30 was considered a reasonable cut-off for having school-aged siblings, as the potential gain of linking older people in 2021 was becoming negligible in terms of efficiency and necessity.
For children living in a household with two parents in 2021, there was no need to find other parents. Linked data sources were used to find any other children belonging to the reported parents, as children living with both their parents might have siblings living elsewhere who received instruction in the minority official language.
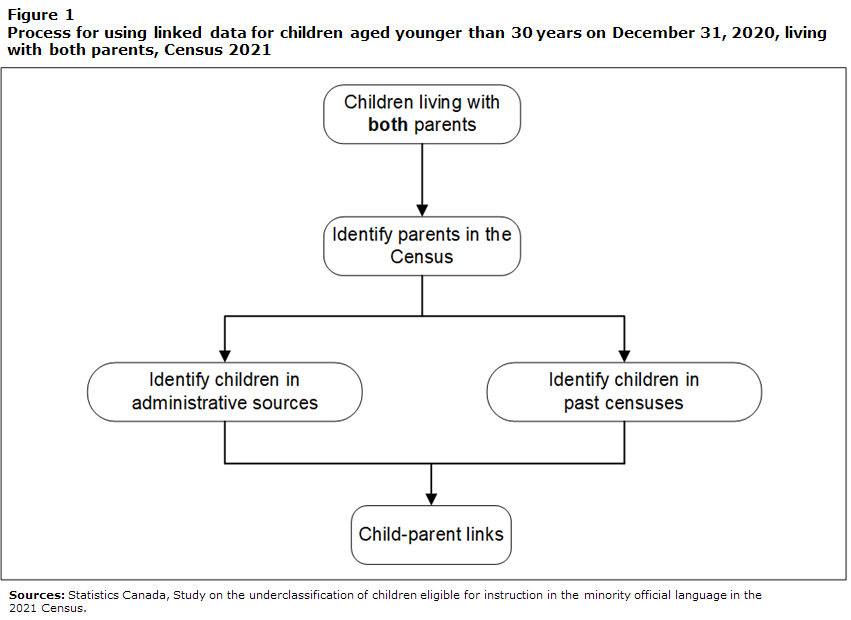
Description for Figure 1
Figure 1 titled, “Process for using linked data for children aged younger than 30 years on December 31, 2020, living with both parents, Census 2021.”
This figure consists of five boxes labelled “Children living with both parents,” “Identify parents in the Census,” “Identify children in administrative sources,” “Identify children in past censuses,” and “Child-parent links.”
The first box labelled “Children living with both parents” has a downward arrow pointing to the “Identify parents in the Census” box.
The “Identify parents in the Census” box has a downward arrow pointing to the “Identify children in administrative sources” box and another downward arrow pointing to the “Identify children in past censuses” box.
The “Identify children in administrative sources” and “Identify children in past censuses” boxes each has a downward arrow pointing to the final box labelled “Child-parent links.”
Sources: Statistics Canada, Study on the underclassification of children eligible for instruction in the minority official language in the 2021 Census.
For children living in a household without their parents (for example, children living with grandparents or unrelated individuals) in 2021, the combined administrative data source and past censuses were used to find a child’s parent or parents. Linked data sources were then used to find any other children belonging to these newly linked parents.
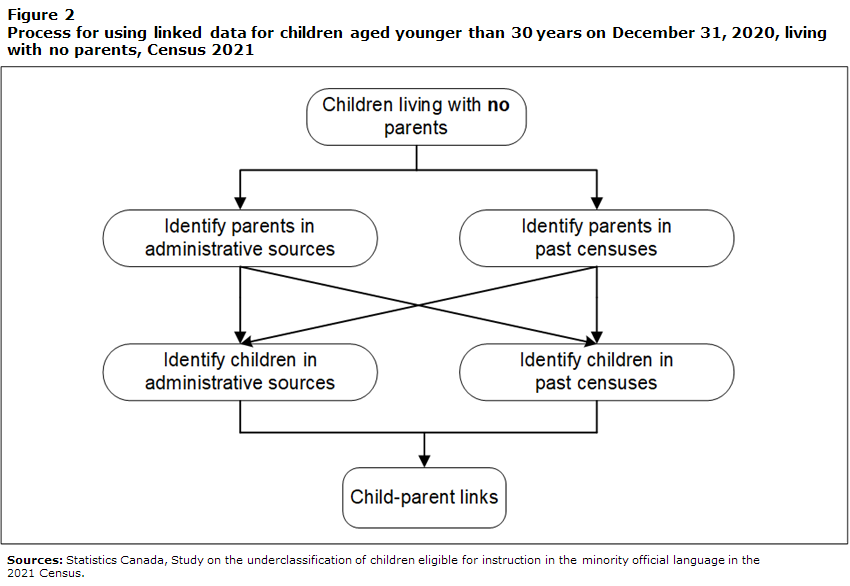
Description for Figure 2
Figure 2 titled, “Process for using linked data for children aged younger than 30 years on December 31, 2020, living with no parents, Census 2021.”
This figure consists of six boxes labelled “Children living with no parents,” “Identify parents in administrative sources,” “Identify parents in past censuses,” “Identify children in administrative sources,” “Identify children in past censuses,” and “Child-parent links.”
The first box labelled “Children living with no parents” has a downward arrow pointing to the “Identify parents in administrative sources” box and another downward arrow pointing to the “Identify parents in past censuses” box.
The “Identify parents in administrative sources” box has a downward arrow pointing to the “Identify children in administrative sources” box and another arrow pointing to the “Identify children in past censuses” box.
The “Identify parents in past censuses” box has a downward arrow pointing to the “Identify children in administrative sources” box and another downward arrow pointing to the “Identify children in past censuses” box.
The “Identify children in administrative sources” box has a downward arrow pointing to the box labelled “Child-parent links.”
The “Identify children in past censuses” box has a downward arrow pointing to the box labelled “Child-parent links.”
Sources: Statistics Canada, Study on the underclassification of children eligible for instruction in the minority official language in the 2021 Census.
For children in one-parent households in the 2021 Census, the combined administrative data source was used to find the spouse of this parent at the time of the child’s birth, and the past censuses data source was used to find anyone who reported being the parent of the child on a past census. The linked data sources are then used to find any other children belonging to the existing and newly linked parents.
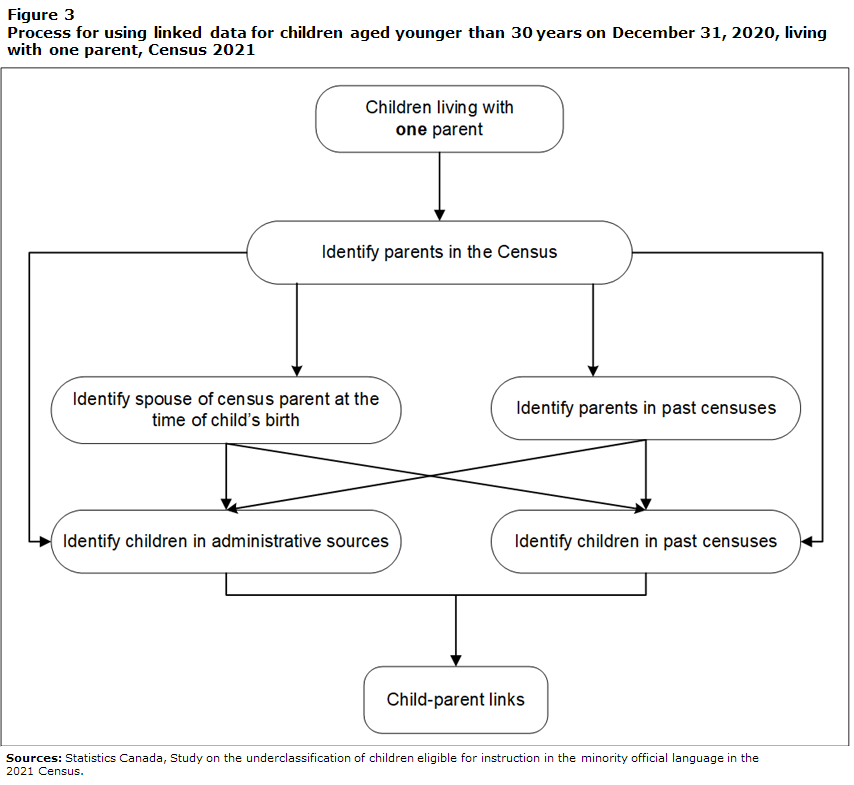
Description for Figure 3
Figure 3 titled, “Process for using linked data for children aged younger than 30 years on December 31, 2020, living with one parent, Census 2021.”
This figure consists of seven boxes labelled “Children living with one parent,” “Identify parents in the Census,” “Identify spouse of census parent at the time of child’s birth,” “Identify parents in past censuses,” “Identify children in administrative sources,” “Identify children in past censuses,” and “Child-parent links.” It illustrates the process for using linked data.
The first box labelled “Children living with one parent” has a downward arrow pointing to the “Identify parents in the Census” box.
The “Identify parents in the Census” box has four downward arrows; the first points to the “Identify spouse of census parent at the time of child’s birth” box, the second to the “Identify parents in past censuses” box, the third to the “Identify children in administrative sources” box, and the fourth to “Identify children in past censuses” box.
The “Identify spouse of census parent at the time of child’s birth” box has a downward arrow pointing to the “Identify children in administrative sources” box and another pointing to the “Identify children in past censuses” box.
The “Identify parents in past censuses” box has a downward arrow pointing to the “Identify children in administrative sources” box and another pointing to the “Identify children in past censuses” box.
The “Identify children in administrative sources” box has a downward arrow that points to the box labelled “Child-parent links.”
The “Identify children in past censuses” box has a downward arrow that points to the box labelled “Child-parent links.”
Sources: Statistics Canada, Study on the underclassification of children eligible for instruction in the minority official language in the 2021 Census.
In some cases, the process resulted in a larger number of potential parents than is realistic. In this event, links were prioritized based on the likelihood of parental relationships. Links with the past censuses were considered the strongest given the consistency of their concepts with the 2021 Census, followed by parental links with the vital statistics in the combined administrative file (more conservative conceptually), and finally other parental links in the administrative file. In some cases, more than two parents were retained, as this can happen in the case of adoption (the census cannot distinguish biological and adopted children [see Section 3—Concepts and definitions]). However, the vast majority of children ended up being linked with two parents.
Once parent–child links were obtained for the entire population of Canada younger than 30, the approach also established links with all siblings through the common parent(s).
After the children’s parents and siblings were found within the linked data sources, an updated version of the eligibility for instruction in the minority official language was created using the 2021 Census, based on the responses provided by the relatives living in other households. At this point, the linkage process found the parents or siblings of the population younger than 30 living at a different address. However, the reclassification of eligibility is only applied to children residing in Canada who were younger than 18 on December 31, 2020. The criteria were applied exactly as they were with the 2021 Census (see Section 3—Concepts and definitions) and with the same census variables, except the family relationship that was updated to include relationships with people living in other households that were identified through the linkage process.
Given the difference in the 2021 Census questions asked to respondents living in Quebec with those living in Canada outside Quebec, a supplementary assumption was required when one sibling was living in Quebec and another was living in Canada outside Quebec. In Quebec, the question related to the language of instruction asks if respondents were schooled in English, while in Canada outside Quebec, the question asks if respondents were schooled in French. In other words, the census did not ask if respondents were schooled in the majority language. For example, if a child living in Quebec has a sibling in Ontario, it is known whether the sibling received their instruction in French or not, but the sibling was not asked if they received their instruction in English. For these cases, the following assumptions were made: If a respondent in Quebec was not schooled in English, it was assumed that they were schooled in French. Similarly, if a respondent residing in Canada outside Quebec was not schooled in French, it was assumed they were schooled in English. In some cases, this approach may have assigned eligibility for instruction in the minority official language to children who, instead, may have been schooled in other languages; however, the percentage of cases with two siblings living in this scenario is small.
4.3 Imputation for children who were considered non eligible and could not be found in sources other than the 2021 Census
A small number of children who were classified in the 2021 Census as non eligible for instruction in the minority official language of their province could not be found in the other sources used. For these children, the final eligibility status is considered to be “non-response” because the links that could have allowed the updating of the eligibility status were missing. As with any non-response situation, there is a risk of bias if non-respondents (or here, unlinked individuals) have different characteristics compared with respondents (or here, linked individuals). The group of children who were not found through linkages in the other data sources represents less than 1% of all the children in the 2021 Census. To alleviate potential biases that would arise from this situation, an imputation process was undertaken based on the imputation strategy used for the language of instruction variables in the 2021 Census. Briefly, the imputation process consists of finding auxiliary variables available for all children, both unlinked and linked, that are correlated with the language of instruction variables. These variables are then used to build a pool of potential donors who have characteristics similar to those of the unlinked children. Finally, for each unlinked child, a donor is randomly selected from the pool of donors, and their eligibility status is attributed to the unlinked child.
Since the donor selection is based on a random process, the imputation process for the unlinked children was performed 500 times, and their final eligibility is based on the proportion of times their eligibility was imputed positively over those 500 imputations. Imputation of the eligibility status of these unlinked children is a source of variability in the results; however, performing the imputation this large number of times helps mitigate that variability.
4.4 Quality indicators
The data quality of this study is largely based on the data quality of the 2021 Census and the linkage processes. For the 2021 Census, no new processes were performed to the existing variables used to classify the children eligible for instruction in the minority official language, and no individuals were added to or removed from the database. Readers are invited to consult the existing documentation to know more about the strengths and limitations of the 2021 Census,Note 9 which also apply to this study.
Given that the sole purpose of this study is to obtain additional parental or sibling links to reclassify children eligible for instruction in the minority official language of their province when the complete family relationship was unknown according to census data, special attention is paid to the quality of the required record linkages.
First, the quality of the results obtained in this study relies on the linkage rates (see Section 4.1—Overview of linkages). Nevertheless, these rates are available at a highly aggregated level, and in the case of this study, where parental links come from a variety of sources, the quality may depend on the consistency of the information found in the data sources and the strength of the information on family relationships obtained. For this reason, a composite quality index (CQI) was developed to better visualize the linkage quality associated with the numbers and rates produced for children living in private dwellings in Canada who were younger than 18 years on December 31, 2020. Because an additional process of imputation was required for the unlinked children, the CQI was designed to take this process into account. The CQI was also designed to accompany each of the numbers and percentages presented in the tables in Appendix A.
To obtain the CQI for each child reclassified as eligible, an index from A to F was assigned to identify the type of link that led to the reclassification. The CQI value is associated with the provenance of each parental link, as the concept of parent in the sources used differs to a greater or lesser extent from the census concept (see Section 3.2—Differences between census concepts and other data sources used), and the consistency between parental links obtained using the various sources. A quality label ranging from “Excellent” to “Use with caution” was assigned according to the type of link. An index of F was assigned to unlinked children who, according to the 2021 Census, were ineligible, and had their final eligibility status imputed. For these cases, the quality is acceptable because the resulting eligibility proportion is from a reliable imputation process repeated 500 times. Table 3 shows the CQI with the quality label according to the reliability of the link and a description of the types of links and imputation.
| CQI value | Label | Description |
|---|---|---|
| A | Excellent | Have one or two parents and three of three sources of parental links are consistent |
| B | Very good | Have one or two parents and two of three sources of parental links are consistent |
| C | Good | Have more than two parents and very strong signal of parental link |
| D | Acceptable | Have more than two parents and strong signal of parental link |
| E | Use with caution | Have more than two parents and weak signal of parental link |
| F | Acceptable — imputed value | Not already eligible for instruction in the minority official language and were not able to link the child—new eligibility status imputed |
|
CQI = Composite Quality Index Sources: Statistics Canada, Census of Population, 2021 and Study on the underclassification of children eligible for instruction in the minority official language in the 2021 Census. |
||
For each of the numbers and rates presented in the tables in Appendix A, the distribution of the CQI values assigned to the reclassified children is presented to guide users in interpreting the data. See Table 4 for an example.
| Geography | Additional children given eligibility | CQI | |||||
|---|---|---|---|---|---|---|---|
| A | B | C | D | E | F | ||
| percent | |||||||
| Canada | 91,740 | 37.5 | 43.9 | 3.0 | 4.4 | 7.7 | 3.5 |
| Quebec | 34,090 | 39.6 | 44.3 | 2.7 | 4.3 | 6.5 | 2.6 |
| Canada outside Quebec | 57,650 | 36.2 | 43.7 | 3.2 | 4.5 | 8.3 | 4.0 |
|
CQI = Composite Quality Index Sources: Statistics Canada, Census of Population, 2021 and Study on the underclassification of children eligible for instruction in the minority official language in the 2021 Census. |
|||||||
5. Results
This study estimates that 91,740 children under the age of 18 on December 31, 2020, were eligible for instruction in the minority official language but were classified as ineligible for this instruction in the 2021 Census (reclassified children in the following text). This means that if—when the criteria in the Canadian Charter of Rights and Freedoms were applied in the 2021 Census—we could have linked each child to all their parents and siblings, the number of children eligible for instruction in the minority official language would have been higher by 91,740 and would have totalled 988,940 (adjusted total in the following text).Note 10 The number of reclassified children represents 9.3% of the adjusted total of the children eligible for instruction in the minority official language, the remaining 90.7% having been enumerated in 2021 (Chart 1).

Data table for Chart 1
| Children reclassified | Children enumerated (2021) | |
|---|---|---|
| number | ||
| Canada | 91,740 | 897,200 |
| Sources: Statistics Canada, Census of Population, 2021 and Study on the underclassification of children eligible for instruction in the minority official language in the 2021 Census. | ||
The majority of reclassified children were reclassified based on the instruction received by siblings, whom this study found in either a previous census or an administrative source. Of the 91,740 reclassified children,Note 11 56% were reclassified solely because of the instruction received by a sibling living in another household, often after leaving the parental home; 35% were reclassified because of a parent’s mother tongue or the instruction they received (most of the time, these were children living in a one-parent or blended family); and 9% were reclassified because of both a sibling and a parent.
As expected, children living with both parents at the time of the census are those for whom the reclassification rate is the lowest (3.1%). Children living with both parents who were reclassified as eligible are those with a sibling who received instruction in the minority official language and lived in another dwelling. Almost 21,000 children were in this situation. The vast majority of children live with both parents.
The reclassification rates are higher when one of the two parents is absent from the household. These rates are 19.6% for children living in a one-parent family and 24.4% for children living in a blended family. For children who do not live with either of their parents (e.g., living with their grandparents, an uncle, an aunt or non-related people, or living in an institution), the reclassification rate is 55%. Very few children live with neither of their parents.
The propensity to live with both parents is higher among the youngest children and decreases with age. Therefore, 81.9% of children aged 0 to 4 years live with both parents, compared with 71.7% of 5- to 11-year-olds and 62.5% of 12- to 17-year-olds. This distribution explains, in large part, the differences in the reclassification rate by age. The percentage of reclassified children is lower among the youngest children (6.2%) and increases with age to reach 11.7% among secondary-school-aged children (12 to 17 years) (Chart 2).
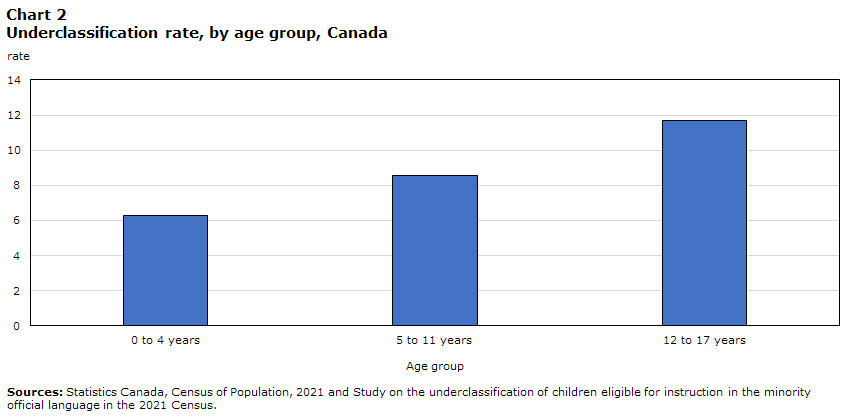
Data table for Chart 2
| Age group | rate |
|---|---|
| 0 to 4 years | 6.29 |
| 5 to 11 years | 8.57 |
| 12 to 17 years | 11.71 |
| Sources: Statistics Canada, Census of Population, 2021 and Study on the underclassification of children eligible for instruction in the minority official language in the 2021 Census. | |
If the results vary by age, they also differ by region. In Quebec, there are 34,090 reclassified children, a reclassification rate of 10.1%, slightly higher than the national average. About half of these children (16,595) lived in the Montréal census metropolitan area (CMA). Because almost two-thirds of the eligible children enumerated in 2021 lived in that area, the result was a reclassification rate (7.7%) that was below the provincial average.
| Region | Number of children reclassified | Number of children enumerated (2021) | Adjusted total | Reclassification rate (%) |
|---|---|---|---|---|
| Quebec | 34,090 | 303,855 | 337,945 | 10.1 |
| Montreal CMA | 16,595 | 199,355 | 215,950 | 7.7 |
| Rest of Quebec | 17,495 | 104,500 | 121,995 | 14.3 |
|
CMA = Census Metropolitan Area Sources: Statistics Canada, Census of Population, 2021 and Study on the underclassification of children eligible for instruction in the minority official language in the 2021 Census. |
||||
In the rest of Quebec, reclassified children represented 14.3% of all children eligible for instruction in English (enumerated and reclassified). Of these reclassified children, 2,030 lived in the Gatineau CMA, 2,635 in the Québec CMA and 1,015 in the Sherbrooke CMA.
In Canada outside Quebec, 57,650 children considered ineligible in the 2021 Census were identified as eligible in the study. This number represents 8.9% of the adjusted total of children eligible for instruction in French at the primary and secondary school levels (Table 6).
| Region | Number of children reclassified | Number of children enumerated (2021) | Adjusted total | Reclassification rate (%) |
|---|---|---|---|---|
| Atlantic | 5,215 | 71,955 | 77,170 | 6.8 |
| Newfoundland and Labrador | 555 | 2,955 | 3,510 | 15.8 |
| Prince Edward Island | 325 | 2,865 | 3,190 | 10.2 |
| Nova Scotia | 1,860 | 16,800 | 18,660 | 10.0 |
| New Brunswick | 2,475 | 49,335 | 51,810 | 4.8 |
| Ontario | 31,335 | 349,875 | 381,210 | 8.2 |
| Ottawa–Gatineau CMA (Ontario part only) |
3,985 | 82,355 | 86,340 | 4.6 |
| Toronto CMA | 8,830 | 103,835 | 112,665 | 7.8 |
| Prairies | 13,545 | 113,160 | 126,705 | 10.7 |
| Manitoba | 3,550 | 30,475 | 34,025 | 10.4 |
| Winnipeg CMA | 2,240 | 21,580 | 23,820 | 9.4 |
| Saskatchewan | 2,085 | 15,540 | 17,625 | 11.8 |
| Alberta | 7,910 | 67,145 | 75,055 | 10.5 |
| Calgary CMA | 2,455 | 23,980 | 26,435 | 9.3 |
| Edmonton CMA | 2,945 | 25,140 | 28,085 | 10.5 |
| British Columbia | 7,200 | 55,575 | 62,775 | 11.5 |
| Vancouver CMA | 2,905 | 27,520 | 30,425 | 9.5 |
| Territories | 355 | 2,800 | 3,155 | 11.3 |
| Total – Canada outside Quebec | 57,650 | 593,365 | 651,015 | 8.9 |
|
CMA = Census Metropolitan Area Note: Counts are calculated on rounded data and may not necessarily add up to the total. Sources: Statistics Canada, Census of Population, 2021 and Study on the underclassification of children eligible for instruction in the minority official language in the 2021 Census. |
||||
The geographic distribution of children that this study reclassified generally follows that of children eligible for instruction in French enumerated in the 2021 Census. Therefore, the highest number of reclassified children in Canada outside Quebec live in Ontario. That number is close to 32,000, more than half of the 58,000 reclassified children in Canada outside Quebec. Alberta ranks second (7,910), followed by British Columbia (7,200), Manitoba (3,550) and New Brunswick (2,475).
Furthermore, over two-thirds of reclassified children in Canada outside Quebec live in the country’s largest urban areas. Over 40,000 of them live in a CMA. Of these reclassified children, 8,830 live in the Toronto area, 3,985 in the Ottawa area (the Ontario portion of the CMA), 2,945 in the Edmonton area, 2,905 in the Vancouver area, 2,240 in the Winnipeg area and 2,455 in the Calgary area. In Atlantic Canada, the highest numbers of reclassified children live in Halifax (865) and Moncton (715).
In the large areas and the provinces of Canada outside Quebec, the reclassification rates are lower than the average in New Brunswick and Ontario, but higher in the other provinces and territories, the highest rate being in Newfoundland and Labrador.
In Canada outside Quebec and in Quebec, the reclassification rates seem generally lower in areas where there is a higher concentration of people with the minority official language: Montréal in Quebec and New Brunswick in Canada outside Quebec. In this regard, Ottawa (4.6%) and Moncton (5.0%) are the two CMAs that have the lowest rates among all CMAs in the country. These two CMAs also have the highest proportions of people with the minority official language of all CMAs in the country. The rates are also relatively low in non-metropolitan areas with a francophone concentration in New Brunswick and Ontario. In the area consisting of northern, northeastern and eastern New Brunswick, the rate is 2.7%; it is 6.1% in eastern Ontario.
The lower propensity of people with a minority official language to live in a linguistically exogamous situation in the areas where they represent a high proportion of the population may be a factor that explains the lower reclassification rates observed in these areas. Children living in these areas with only one of their parents probably have a lower chance that the parent not living with them presents characteristics that differ from the other parent in terms of the charter criteria on mother tongue and instruction in the minority official language.
The various regions of the country also differ regarding the two other factors related to the reclassification rates mentioned earlier: propensity to live in a one-parent or blended family and the age structure of the population of children. Having more one-parent or blended families and more older children increases the reclassification rates. Family size, which is linked to fertility, and differences in the propensity to leave the parental home at an earlier or later age are also factors that may change the number of siblings living in another household and, consequently, the reclassification rates.
6. Conclusion
The objective of this reportNote 12 was to present the results of a study on the estimated number of children eligible for instruction in the minority official language under section 23 of the Canadian Charter of Rights and Freedoms who were classified as ineligible in the 2021 Census because it could not establish links between members of the same family who lived at different addresses. With other data sources, specifically previous censuses and administrative data (vital statistics and various tax data), these family ties could be identified.
The results show that almost 92,000 children considered ineligible in the 2021 Census had a parent or sibling living in another household who met one of the charter criteria. These were more often siblings than parents. The children most likely to be reclassified were those not living with both parents, notably children living in a one-parent or blended family.
Lastly, the report showed many differences across Canadian provinces and regions, which are documented in detail in the appendix tables.
This study has certain limitations that must be considered when interpreting the results. Other than the limitations inherent to the data sources used, such as the inevitable coverage issues, the quality of this study’s results depends essentially on the quality of the matching among the sources and the conceptual consistency between them and the 2021 Census. In addition, some parental links could not be established by using the available information sources.
To work around these limitations, efforts were made to prioritize the most reliable links, thereby preserving the family concepts in the 2021 Census as much as possible. Imputation was also used to make up for missing information on children for whom parents or siblings could not be found in the other data sources used in this study. A quality index for the estimates was also developed and made available to users so that they can make their own judgments on the estimates provided. This index tends to show that the underclassification numbers and rates rely mostly on matches of very high or excellent quality.
Appendix A
| Geography | Age 0 to 4 years | ||||||||
|---|---|---|---|---|---|---|---|---|---|
| Underclassification | 2021 Census | CQI | |||||||
| A | B | C | D | E | F | ||||
| number | percent | number | percent | ||||||
| Newfoundland and Labrador | |||||||||
| Total | 60 | 8.0 | 690 | 87.6 | 10.9 | 0.0 | 0.3 | 0.9 | 0.3 |
| St. John's | 25 | 6.4 | 365 | 90.6 | 8.5 | 0.0 | 0.2 | 0.4 | 0.3 |
| Non-CMA | 35 | 9.7 | 325 | 84.9 | 13.0 | 0.1 | 0.3 | 1.3 | 0.4 |
| Prince Edward Island | |||||||||
| Total | 40 | 6.3 | 595 | 89.8 | 9.0 | 0.0 | 0.4 | 0.7 | 0.2 |
| Nova Scotia | |||||||||
| Total | 265 | 6.6 | 3,725 | 87.9 | 10.5 | 0.0 | 0.3 | 1.0 | 0.4 |
| Halifax | 135 | 6.3 | 2,015 | 90.7 | 8.1 | 0.0 | 0.2 | 0.7 | 0.3 |
| Non-CMA | 135 | 7.3 | 1,710 | 84.7 | 13.0 | 0.0 | 0.5 | 1.3 | 0.5 |
| New Brunswick | |||||||||
| Total | 445 | 3.8 | 11,245 | 86.8 | 11.4 | 0.0 | 0.4 | 0.9 | 0.4 |
| Fredericton | 50 | 5.4 | 870 | 89.7 | 9.1 | 0.0 | 0.3 | 0.7 | 0.3 |
| Moncton | 110 | 3.4 | 3,165 | 88.3 | 10.4 | 0.0 | 0.4 | 0.6 | 0.3 |
| Saint John | 40 | 6.1 | 620 | 87.3 | 11.1 | 0.0 | 0.4 | 0.9 | 0.3 |
| Non-CMA | 245 | 3.6 | 6,590 | 84.9 | 12.9 | 0.0 | 0.5 | 1.2 | 0.5 |
| English non-CMA | 40 | 8.0 | 460 | 84.3 | 13.5 | 0.0 | 0.5 | 1.2 | 0.5 |
| French non-CMA | 205 | 3.2 | 6,110 | 86.2 | 11.8 | 0.0 | 0.5 | 1.1 | 0.4 |
| Quebec | |||||||||
| Total | 5,255 | 7.1 | 68,365 | 88.5 | 10.3 | 0.0 | 0.3 | 0.6 | 0.3 |
| Drummondville | 50 | 11.0 | 405 | 83.9 | 14.5 | 0.0 | 0.4 | 0.9 | 0.3 |
| Montréal | 2,650 | 5.7 | 44,115 | 90.1 | 8.9 | 0.0 | 0.2 | 0.5 | 0.2 |
| Ottawa–Gatineau | 885 | 3.7 | 22,890 | 92.5 | 6.8 | 0.0 | 0.2 | 0.4 | 0.2 |
| Ottawa–Gatineau (Quebec part) | 315 | 6.6 | 4,465 | 87.7 | 11.0 | 0.0 | 0.4 | 0.7 | 0.3 |
| Québec | 365 | 11.1 | 2,925 | 89.8 | 9.5 | 0.0 | 0.2 | 0.4 | 0.1 |
| Saguenay | 75 | 11.0 | 605 | 87.4 | 11.4 | 0.0 | 0.3 | 0.8 | 0.1 |
| Sherbrooke | 145 | 9.2 | 1,425 | 87.2 | 11.5 | 0.0 | 0.2 | 0.9 | 0.3 |
| Trois-Rivières | 75 | 11.3 | 590 | 85.6 | 13.0 | 0.0 | 0.3 | 0.7 | 0.4 |
| Non-CMA | 1,585 | 10.3 | 13,835 | 85.7 | 12.6 | 0.0 | 0.4 | 0.8 | 0.4 |
| Ontario | |||||||||
| Total | 4,460 | 5.6 | 75,235 | 91.0 | 7.9 | 0.0 | 0.3 | 0.5 | 0.3 |
| Barrie | 80 | 9.2 | 785 | 89.5 | 9.2 | 0.0 | 0.4 | 0.7 | 0.3 |
| Belleville–Quinte West | 55 | 9.6 | 520 | 85.7 | 12.6 | 0.0 | 0.3 | 0.9 | 0.5 |
| Brantford | 50 | 9.6 | 470 | 88.2 | 10.6 | 0.0 | 0.3 | 0.6 | 0.3 |
| Greater Sudbury | 175 | 4.9 | 3,430 | 86.4 | 11.6 | 0.0 | 0.4 | 0.9 | 0.6 |
| Guelph | 45 | 6.8 | 620 | 92.4 | 7.1 | 0.0 | 0.1 | 0.3 | 0.1 |
| Hamilton | 200 | 7.1 | 2,605 | 91.6 | 7.5 | 0.0 | 0.2 | 0.5 | 0.3 |
| Kingston | 60 | 5.8 | 970 | 88.9 | 9.6 | 0.0 | 0.3 | 1.0 | 0.2 |
| Kitchener–Cambridge–Waterloo | 155 | 7.7 | 1,865 | 92.0 | 7.1 | 0.0 | 0.2 | 0.4 | 0.2 |
| London | 170 | 6.9 | 2,310 | 90.0 | 8.8 | 0.0 | 0.3 | 0.6 | 0.3 |
| Oshawa | 120 | 6.6 | 1,710 | 90.9 | 8.1 | 0.0 | 0.3 | 0.6 | 0.2 |
| Ottawa–Gatineau | 885 | 3.7 | 22,890 | 92.5 | 6.8 | 0.0 | 0.2 | 0.4 | 0.2 |
| Ottawa–Gatineau (Ontario part) | 570 | 3.0 | 18,425 | 91.2 | 7.9 | 0.0 | 0.2 | 0.5 | 0.2 |
| Peterborough | 35 | 9.6 | 330 | 88.7 | 9.8 | 0.0 | 0.2 | 0.9 | 0.3 |
| St. Catharines–Niagara | 140 | 7.8 | 1,660 | 88.2 | 10.2 | 0.0 | 0.3 | 0.8 | 0.4 |
| Thunder Bay | 40 | 8.9 | 410 | 85.1 | 12.1 | 0.0 | 0.4 | 1.4 | 1.0 |
| Toronto | 1,260 | 6.0 | 19,660 | 92.3 | 6.8 | 0.0 | 0.2 | 0.4 | 0.2 |
| Windsor | 170 | 5.1 | 3,150 | 90.4 | 8.4 | 0.0 | 0.3 | 0.6 | 0.3 |
| Non-CMA | 1,125 | 6.5 | 16,315 | 88.5 | 9.9 | 0.0 | 0.3 | 0.8 | 0.5 |
| English non-CMA | 850 | 7.9 | 9,965 | 83.8 | 14.2 | 0.0 | 0.4 | 1.0 | 0.6 |
| French non-CMA | 285 | 4.3 | 6,325 | 89.0 | 9.4 | 0.0 | 0.3 | 0.8 | 0.5 |
| Manitoba | |||||||||
| Total | 530 | 7.1 | 6,930 | 88.6 | 9.3 | 0.0 | 0.3 | 0.7 | 1.1 |
| Winnipeg | 325 | 6.3 | 4,805 | 89.9 | 8.7 | 0.0 | 0.2 | 0.6 | 0.7 |
| Non-CMA | 215 | 9.2 | 2,125 | 86.9 | 10.1 | 0.1 | 0.5 | 0.9 | 1.6 |
| Saskatchewan | |||||||||
| Total | 285 | 7.5 | 3,495 | 87.9 | 9.9 | 0.0 | 0.4 | 0.9 | 0.9 |
| Regina | 70 | 7.1 | 915 | 89.5 | 9.1 | 0.0 | 0.3 | 0.7 | 0.4 |
| Saskatoon | 75 | 5.8 | 1,225 | 90.2 | 8.4 | 0.0 | 0.3 | 0.6 | 0.5 |
| Non-CMA | 135 | 9.1 | 1,355 | 85.9 | 11.0 | 0.0 | 0.5 | 1.2 | 1.3 |
| Alberta | |||||||||
| Total | 1,095 | 6.4 | 16,145 | 91.1 | 7.8 | 0.0 | 0.2 | 0.5 | 0.4 |
| Calgary | 330 | 5.5 | 5,690 | 92.5 | 6.7 | 0.0 | 0.2 | 0.4 | 0.2 |
| Edmonton | 415 | 6.2 | 6,275 | 91.0 | 8.0 | 0.0 | 0.2 | 0.5 | 0.3 |
| Lethbridge | 25 | 8.9 | 255 | 90.7 | 8.3 | 0.0 | 0.2 | 0.5 | 0.3 |
| Red Deer | 25 | 8.2 | 280 | 88.7 | 10.0 | 0.0 | 0.4 | 0.6 | 0.2 |
| Non-CMA | 290 | 7.4 | 3,645 | 89.6 | 8.8 | 0.0 | 0.3 | 0.7 | 0.6 |
| British Columbia | |||||||||
| Total | 825 | 6.7 | 11,580 | 91.3 | 7.5 | 0.0 | 0.3 | 0.5 | 0.4 |
| Abbotsford–Mission | 45 | 10.8 | 370 | 90.8 | 7.9 | 0.0 | 0.4 | 0.5 | 0.3 |
| Chilliwack | 25 | 8.9 | 255 | 89.7 | 8.9 | 0.0 | 0.3 | 0.7 | 0.4 |
| Kamloops | 15 | 5.2 | 275 | 89.6 | 9.2 | 0.0 | 0.2 | 0.5 | 0.4 |
| Kelowna | 40 | 6.8 | 545 | 91.2 | 7.7 | 0.0 | 0.3 | 0.5 | 0.3 |
| Nanaimo | 35 | 10.9 | 285 | 88.0 | 10.3 | 0.0 | 0.3 | 0.9 | 0.4 |
| Vancouver | 335 | 5.7 | 5,515 | 93.0 | 6.1 | 0.0 | 0.3 | 0.3 | 0.3 |
| Victoria | 75 | 6.7 | 1,050 | 91.3 | 7.6 | 0.0 | 0.2 | 0.6 | 0.3 |
| Non-CMA | 260 | 7.3 | 3,285 | 88.2 | 10.0 | 0.0 | 0.3 | 0.9 | 0.6 |
| Yukon | |||||||||
| Total | 20 | 5.9 | 320 | 88.1 | 10.3 | 0.0 | 0.1 | 0.6 | 0.8 |
| Northwest Territories | |||||||||
| Total | 20 | 6.3 | 300 | 84.8 | 12.4 | 0.1 | 0.6 | 1.2 | 0.8 |
| Nunavut | |||||||||
| Total | 40 | 20.0 | 160 | 85.4 | 10.6 | 0.1 | 0.5 | 1.1 | 2.2 |
| Canada | |||||||||
| Total | 13,340 | 6.3 | 198,785 | 90.0 | 8.7 | 0.0 | 0.3 | 0.6 | 0.4 |
|
CQI = Composite Quality Index CMA = Census Metropolitan Area Note: Counts are calculated on rounded data and may not necessarily add up to the total. Sources: Statistics Canada, Census of Population, 2021 and Study on the underclassification of children eligible for instruction in the minority official language in the 2021 Census. |
|||||||||
| Geography | Age 5 to 11 years | ||||||||
|---|---|---|---|---|---|---|---|---|---|
| Underclassification | 2021 Census | CQI | |||||||
| A | B | C | D | E | F | ||||
| number | percent | number | percent | ||||||
| Newfoundland and Labrador | |||||||||
| Total | 210 | 14.2 | 1,265 | 77.3 | 18.4 | 1.5 | 0.9 | 1.5 | 0.5 |
| St. John's | 90 | 12.4 | 635 | 81.4 | 15.3 | 1.3 | 0.8 | 1.1 | 0.2 |
| Non-CMA | 120 | 16.0 | 630 | 73.7 | 21.1 | 1.7 | 0.9 | 1.8 | 0.7 |
| Prince Edward Island | |||||||||
| Total | 125 | 9.1 | 1,250 | 79.7 | 16.2 | 1.2 | 1.0 | 1.6 | 0.2 |
| Nova Scotia | |||||||||
| Total | 640 | 8.3 | 7,070 | 77.9 | 18.1 | 1.3 | 1.0 | 1.5 | 0.3 |
| Halifax | 290 | 7.4 | 3,615 | 82.6 | 14.5 | 1.0 | 0.7 | 0.9 | 0.2 |
| Non-CMA | 345 | 9.1 | 3,455 | 73.0 | 21.7 | 1.6 | 1.3 | 2.1 | 0.4 |
| New Brunswick | |||||||||
| Total | 870 | 4.2 | 19,650 | 76.1 | 19.8 | 1.5 | 1.0 | 1.4 | 0.2 |
| Fredericton | 110 | 6.6 | 1,550 | 80.6 | 15.9 | 1.4 | 0.8 | 1.2 | 0.1 |
| Moncton | 250 | 4.3 | 5,620 | 77.9 | 18.8 | 1.2 | 0.7 | 1.2 | 0.2 |
| Saint John | 125 | 10.2 | 1,105 | 77.0 | 18.6 | 1.5 | 1.0 | 1.7 | 0.2 |
| Non-CMA | 385 | 3.3 | 11,375 | 73.2 | 22.3 | 1.6 | 1.1 | 1.5 | 0.3 |
| English non-CMA | 120 | 14.5 | 705 | 72.6 | 22.9 | 1.5 | 1.1 | 1.5 | 0.4 |
| French non-CMA | 260 | 2.4 | 10,670 | 74.3 | 21.1 | 1.6 | 1.3 | 1.6 | 0.2 |
| Quebec | |||||||||
| Total | 12,865 | 9.6 | 121,095 | 78.5 | 17.8 | 1.7 | 0.9 | 0.9 | 0.2 |
| Drummondville | 180 | 21.6 | 655 | 74.8 | 20.8 | 1.6 | 1.3 | 1.2 | 0.2 |
| Montréal | 6,145 | 7.2 | 79,205 | 81.6 | 15.3 | 1.6 | 0.7 | 0.7 | 0.2 |
| Ottawa–Gatineau | 2,235 | 5.1 | 41,595 | 84.4 | 13.1 | 1.2 | 0.5 | 0.6 | 0.2 |
| Ottawa–Gatineau (Quebec part) | 775 | 9.0 | 7,815 | 77.6 | 18.5 | 1.7 | 1.0 | 1.0 | 0.2 |
| Québec | 1,005 | 14.7 | 5,835 | 80.4 | 16.3 | 1.7 | 0.9 | 0.7 | 0.1 |
| Saguenay | 220 | 16.7 | 1,100 | 74.5 | 20.2 | 2.5 | 1.4 | 1.1 | 0.2 |
| Sherbrooke | 405 | 13.4 | 2,620 | 76.3 | 19.8 | 1.3 | 1.3 | 1.1 | 0.2 |
| Trois-Rivières | 205 | 14.9 | 1,175 | 74.2 | 21.6 | 1.4 | 1.2 | 1.2 | 0.4 |
| Non-CMA | 3,930 | 14.8 | 22,690 | 72.7 | 22.4 | 1.9 | 1.3 | 1.3 | 0.4 |
| Ontario | |||||||||
| Total | 11,525 | 7.4 | 143,310 | 82.5 | 14.1 | 1.6 | 0.7 | 0.9 | 0.2 |
| Barrie | 200 | 11.0 | 1,615 | 80.2 | 16.3 | 1.4 | 1.0 | 1.0 | 0.2 |
| Belleville–Quinte West | 130 | 13.0 | 870 | 72.9 | 22.6 | 1.1 | 1.2 | 1.8 | 0.4 |
| Brantford | 140 | 14.2 | 845 | 79.2 | 17.3 | 1.3 | 0.7 | 1.3 | 0.2 |
| Greater Sudbury | 430 | 6.7 | 6,020 | 74.5 | 20.5 | 1.7 | 1.3 | 1.6 | 0.3 |
| Guelph | 140 | 9.3 | 1,360 | 82.8 | 14.2 | 1.8 | 0.5 | 0.6 | 0.1 |
| Hamilton | 505 | 9.9 | 4,605 | 83.1 | 14.2 | 1.2 | 0.6 | 0.9 | 0.1 |
| Kingston | 165 | 8.7 | 1,735 | 77.0 | 19.1 | 1.1 | 1.2 | 1.3 | 0.3 |
| Kitchener–Cambridge–Waterloo | 370 | 9.3 | 3,605 | 83.7 | 13.7 | 1.2 | 0.6 | 0.7 | 0.1 |
| London | 490 | 9.8 | 4,530 | 81.5 | 15.3 | 1.2 | 0.8 | 1.0 | 0.2 |
| Oshawa | 320 | 8.6 | 3,385 | 82.5 | 14.1 | 1.4 | 0.8 | 1.0 | 0.2 |
| Ottawa–Gatineau | 2,235 | 5.1 | 41,595 | 84.4 | 13.1 | 1.2 | 0.5 | 0.6 | 0.2 |
| Ottawa–Gatineau (Ontario part) | 1,460 | 4.1 | 33,775 | 82.6 | 14.5 | 1.3 | 0.6 | 0.7 | 0.2 |
| Peterborough | 110 | 15.6 | 595 | 75.7 | 20.1 | 1.5 | 1.0 | 1.3 | 0.2 |
| St. Catharines–Niagara | 385 | 10.9 | 3,140 | 77.4 | 18.6 | 1.5 | 0.9 | 1.3 | 0.3 |
| Thunder Bay | 140 | 15.5 | 765 | 72.1 | 22.4 | 1.0 | 1.8 | 1.9 | 0.9 |
| Toronto | 3,210 | 7.1 | 41,955 | 85.8 | 11.1 | 2.0 | 0.4 | 0.5 | 0.2 |
| Windsor | 430 | 6.5 | 6,165 | 81.5 | 15.2 | 1.3 | 0.7 | 1.0 | 0.2 |
| Non-CMA | 2,890 | 9.3 | 28,345 | 76.4 | 18.8 | 1.7 | 1.1 | 1.6 | 0.4 |
| English non-CMA | 2,230 | 11.4 | 17,310 | 70.2 | 23.9 | 1.9 | 1.5 | 2.1 | 0.5 |
| French non-CMA | 665 | 5.7 | 11,020 | 77.1 | 18.2 | 1.7 | 1.1 | 1.5 | 0.4 |
| Manitoba | |||||||||
| Total | 1,315 | 9.2 | 12,975 | 77.5 | 17.4 | 1.4 | 0.9 | 1.2 | 1.6 |
| Winnipeg | 795 | 7.9 | 9,210 | 81.5 | 15.0 | 1.0 | 0.6 | 1.0 | 0.9 |
| Non-CMA | 520 | 12.1 | 3,765 | 72.3 | 20.6 | 1.8 | 1.2 | 1.6 | 2.5 |
| Saskatchewan | |||||||||
| Total | 820 | 10.6 | 6,940 | 75.6 | 19.1 | 1.6 | 1.1 | 1.5 | 1.1 |
| Regina | 215 | 10.0 | 1,935 | 79.4 | 16.3 | 1.6 | 0.8 | 1.3 | 0.5 |
| Saskatoon | 230 | 8.6 | 2,460 | 80.7 | 15.4 | 1.7 | 0.8 | 0.9 | 0.5 |
| Non-CMA | 375 | 12.8 | 2,545 | 71.2 | 22.2 | 1.6 | 1.4 | 1.9 | 1.7 |
| Alberta | |||||||||
| Total | 3,035 | 9.7 | 28,235 | 81.1 | 15.3 | 1.5 | 0.7 | 0.9 | 0.4 |
| Calgary | 940 | 8.5 | 10,080 | 84.9 | 12.2 | 1.5 | 0.6 | 0.6 | 0.2 |
| Edmonton | 1,155 | 10.0 | 10,440 | 81.8 | 14.9 | 1.4 | 0.7 | 0.9 | 0.3 |
| Lethbridge | 50 | 10.6 | 420 | 81.1 | 15.6 | 1.2 | 0.7 | 1.1 | 0.3 |
| Red Deer | 80 | 12.7 | 550 | 75.5 | 20.7 | 1.3 | 0.9 | 1.3 | 0.2 |
| Non-CMA | 805 | 10.7 | 6,745 | 76.2 | 19.0 | 1.7 | 0.9 | 1.4 | 0.9 |
| British Columbia | |||||||||
| Total | 2,700 | 10.7 | 22,455 | 80.3 | 14.9 | 2.8 | 0.8 | 0.8 | 0.4 |
| Abbotsford–Mission | 150 | 16.2 | 775 | 80.5 | 13.2 | 4.1 | 1.0 | 0.9 | 0.3 |
| Chilliwack | 75 | 14.4 | 445 | 78.0 | 16.9 | 2.1 | 0.9 | 1.5 | 0.6 |
| Kamloops | 70 | 11.8 | 525 | 76.6 | 19.6 | 1.3 | 0.8 | 1.4 | 0.4 |
| Kelowna | 120 | 11.1 | 965 | 79.2 | 16.6 | 2.3 | 0.8 | 0.8 | 0.2 |
| Nanaimo | 130 | 16.5 | 660 | 75.1 | 19.7 | 2.3 | 1.1 | 1.3 | 0.5 |
| Vancouver | 1,070 | 9.1 | 10,695 | 83.8 | 11.7 | 3.2 | 0.6 | 0.5 | 0.2 |
| Victoria | 240 | 10.5 | 2,040 | 80.2 | 15.4 | 2.7 | 0.8 | 0.7 | 0.2 |
| Non-CMA | 835 | 11.6 | 6,350 | 74.3 | 20.4 | 2.0 | 1.1 | 1.5 | 0.7 |
| Yukon | |||||||||
| Total | 55 | 10.7 | 460 | 75.1 | 20.1 | 1.6 | 0.9 | 1.4 | 1.0 |
| Northwest Territories | |||||||||
| Total | 45 | 8.7 | 470 | 69.1 | 25.5 | 1.6 | 1.3 | 1.6 | 0.8 |
| Nunavut | |||||||||
| Total | 40 | 15.7 | 215 | 56.6 | 34.2 | 3.2 | 1.7 | 2.0 | 2.4 |
| Canada | |||||||||
| Total | 34,245 | 8.6 | 365,385 | 80.3 | 15.9 | 1.8 | 0.8 | 1.0 | 0.4 |
|
CQI = Composite Quality Index CMA = Census Metropolitan Area Note: Counts are calculated on rounded data and may not necessarily add up to the total. Sources: Statistics Canada, Census of Population, 2021 and Study on the underclassification of children eligible for instruction in the minority official language in the 2021 Census. |
|||||||||
| Geography | Age 12 to 17 years | ||||||||
|---|---|---|---|---|---|---|---|---|---|
| Underclassification | 2021 Census | CQI | |||||||
| A | B | C | D | E | F | ||||
| number | percent | number | percent | ||||||
| Newfoundland and Labrador | |||||||||
| Total | 285 | 22.1 | 1,005 | 71.3 | 22.5 | 1.7 | 1.5 | 2.1 | 0.8 |
| St. John's | 95 | 16.4 | 485 | 74.8 | 20.1 | 1.5 | 1.3 | 1.6 | 0.6 |
| Non-CMA | 190 | 26.8 | 520 | 68.7 | 24.4 | 1.8 | 1.6 | 2.5 | 1.0 |
| Prince Edward Island | |||||||||
| Total | 160 | 13.5 | 1,025 | 72.7 | 21.0 | 1.6 | 2.0 | 2.0 | 0.7 |
| Nova Scotia | |||||||||
| Total | 955 | 13.7 | 6,005 | 69.7 | 24.1 | 1.5 | 1.7 | 2.3 | 0.7 |
| Halifax | 440 | 13.0 | 2,955 | 74.7 | 20.4 | 1.2 | 1.3 | 1.6 | 0.7 |
| Non-CMA | 520 | 14.6 | 3,050 | 65.0 | 27.5 | 1.8 | 2.1 | 3.0 | 0.7 |
| New Brunswick | |||||||||
| Total | 1,160 | 5.9 | 18,440 | 68.7 | 25.0 | 1.5 | 1.8 | 2.3 | 0.8 |
| Fredericton | 140 | 9.9 | 1,275 | 71.0 | 23.3 | 1.7 | 1.4 | 1.8 | 0.8 |
| Moncton | 355 | 6.7 | 4,935 | 71.3 | 22.9 | 1.2 | 1.5 | 2.0 | 1.2 |
| Saint John | 200 | 15.4 | 1,095 | 69.8 | 23.7 | 1.5 | 1.7 | 2.5 | 0.7 |
| Non-CMA | 465 | 4.0 | 11,135 | 66.2 | 27.0 | 1.6 | 2.0 | 2.5 | 0.8 |
| English non-CMA | 165 | 22.8 | 560 | 66.2 | 27.1 | 1.5 | 2.0 | 2.5 | 0.8 |
| French non-CMA | 300 | 2.8 | 10,530 | 66.1 | 26.8 | 1.9 | 2.1 | 2.5 | 0.6 |
| Quebec | |||||||||
| Total | 15,970 | 12.3 | 114,375 | 70.4 | 24.0 | 1.8 | 1.7 | 1.5 | 0.7 |
| Drummondville | 220 | 22.4 | 760 | 64.9 | 28.1 | 1.7 | 2.5 | 1.9 | 0.9 |
| Montréal | 7,800 | 9.3 | 76,040 | 74.1 | 21.2 | 1.6 | 1.2 | 1.3 | 0.6 |
| Ottawa–Gatineau | 2,895 | 7.3 | 36,860 | 78.3 | 18.0 | 1.2 | 0.9 | 1.0 | 0.7 |
| Ottawa–Gatineau (Quebec part) | 940 | 12.3 | 6,705 | 69.7 | 24.7 | 1.6 | 1.8 | 1.5 | 0.8 |
| Québec | 1,265 | 18.5 | 5,590 | 71.3 | 23.7 | 1.7 | 1.6 | 1.3 | 0.5 |
| Saguenay | 280 | 23.6 | 905 | 65.5 | 27.1 | 2.6 | 2.4 | 1.4 | 1.0 |
| Sherbrooke | 465 | 16.7 | 2,320 | 67.2 | 26.6 | 1.8 | 2.3 | 1.5 | 0.6 |
| Trois-Rivières | 275 | 18.6 | 1,200 | 64.5 | 28.8 | 1.5 | 2.1 | 1.9 | 1.3 |
| Non-CMA | 4,720 | 18.5 | 20,855 | 64.2 | 28.5 | 2.0 | 2.5 | 1.9 | 1.0 |
| Ontario | |||||||||
| Total | 15,350 | 10.5 | 131,330 | 75.9 | 19.0 | 1.7 | 1.1 | 1.4 | 0.8 |
| Barrie | 245 | 14.2 | 1,485 | 71.7 | 23.1 | 1.3 | 1.3 | 1.9 | 0.6 |
| Belleville–Quinte West | 180 | 20.8 | 685 | 63.6 | 29.3 | 1.5 | 2.1 | 2.8 | 0.7 |
| Brantford | 215 | 23.1 | 715 | 69.7 | 24.8 | 1.1 | 1.5 | 2.1 | 0.7 |
| Greater Sudbury | 545 | 9.2 | 5,380 | 65.5 | 27.4 | 1.8 | 2.2 | 2.3 | 0.8 |
| Guelph | 160 | 14.1 | 975 | 75.3 | 20.3 | 1.4 | 1.0 | 1.2 | 0.7 |
| Hamilton | 680 | 13.7 | 4,290 | 76.0 | 19.6 | 1.2 | 1.2 | 1.4 | 0.7 |
| Kingston | 215 | 13.4 | 1,385 | 68.6 | 25.3 | 1.3 | 1.7 | 2.0 | 1.1 |
| Kitchener–Cambridge–Waterloo | 510 | 13.4 | 3,285 | 76.4 | 19.1 | 1.5 | 1.0 | 1.4 | 0.6 |
| London | 650 | 14.1 | 3,960 | 73.9 | 21.6 | 1.0 | 1.2 | 1.5 | 0.8 |
| Oshawa | 460 | 13.5 | 2,955 | 74.4 | 21.2 | 1.3 | 1.1 | 1.4 | 0.5 |
| Ottawa–Gatineau | 2,895 | 7.3 | 36,860 | 78.3 | 18.0 | 1.2 | 0.9 | 1.0 | 0.7 |
| Ottawa–Gatineau (Ontario part) | 1,955 | 6.1 | 30,155 | 76.2 | 19.6 | 1.3 | 1.1 | 1.1 | 0.7 |
| Peterborough | 130 | 20.2 | 515 | 67.2 | 27.1 | 1.3 | 1.9 | 1.9 | 0.7 |
| St. Catharines–Niagara | 545 | 15.8 | 2,910 | 68.4 | 25.2 | 1.3 | 1.8 | 2.1 | 1.1 |
| Thunder Bay | 135 | 16.8 | 670 | 64.7 | 27.7 | 1.3 | 2.3 | 2.6 | 1.4 |
| Toronto | 4,360 | 9.4 | 42,220 | 80.6 | 14.9 | 2.0 | 0.7 | 0.9 | 0.9 |
| Windsor | 555 | 8.9 | 5,665 | 74.9 | 20.3 | 1.5 | 1.1 | 1.5 | 0.7 |
| Non-CMA | 3,825 | 13.7 | 24,080 | 67.9 | 25.0 | 1.9 | 2.1 | 2.3 | 0.9 |
| English non-CMA | 3,030 | 17.2 | 14,575 | 62.7 | 29.2 | 1.6 | 2.7 | 2.7 | 1.1 |
| French non-CMA | 790 | 7.7 | 9,480 | 68.5 | 24.5 | 1.9 | 2.0 | 2.3 | 0.8 |
| Manitoba | |||||||||
| Total | 1,705 | 13.9 | 10,570 | 71.0 | 21.0 | 1.5 | 1.6 | 2.0 | 2.9 |
| Winnipeg | 1,120 | 12.9 | 7,560 | 74.6 | 19.0 | 1.2 | 1.2 | 1.6 | 2.3 |
| Non-CMA | 590 | 16.4 | 3,010 | 66.1 | 23.6 | 1.9 | 2.2 | 2.6 | 3.7 |
| Saskatchewan | |||||||||
| Total | 980 | 16.1 | 5,105 | 68.2 | 23.5 | 1.8 | 2.1 | 2.3 | 2.1 |
| Regina | 220 | 13.5 | 1,405 | 72.5 | 20.6 | 1.9 | 1.7 | 1.9 | 1.4 |
| Saskatoon | 280 | 13.8 | 1,755 | 73.7 | 20.0 | 1.6 | 1.5 | 1.8 | 1.4 |
| Non-CMA | 475 | 19.6 | 1,945 | 63.9 | 26.3 | 1.9 | 2.5 | 2.7 | 2.7 |
| Alberta | |||||||||
| Total | 3,780 | 14.2 | 22,760 | 74.2 | 20.0 | 1.7 | 1.4 | 1.6 | 1.0 |
| Calgary | 1,185 | 12.6 | 8,215 | 78.6 | 16.9 | 1.6 | 1.1 | 1.1 | 0.7 |
| Edmonton | 1,375 | 14.0 | 8,430 | 74.9 | 19.6 | 1.7 | 1.3 | 1.5 | 0.9 |
| Lethbridge | 75 | 16.0 | 395 | 73.7 | 21.0 | 1.4 | 1.4 | 1.6 | 0.9 |
| Red Deer | 90 | 15.5 | 490 | 68.0 | 25.6 | 1.3 | 1.8 | 2.2 | 1.1 |
| Non-CMA | 1,060 | 16.9 | 5,230 | 68.9 | 23.8 | 1.8 | 1.9 | 2.1 | 1.6 |
| British Columbia | |||||||||
| Total | 3,675 | 14.6 | 21,535 | 72.3 | 19.8 | 2.9 | 1.5 | 1.6 | 2.0 |
| Abbotsford–Mission | 195 | 19.0 | 830 | 72.4 | 18.2 | 4.6 | 1.6 | 1.6 | 1.5 |
| Chilliwack | 100 | 19.0 | 425 | 68.4 | 23.3 | 2.1 | 2.0 | 2.5 | 1.7 |
| Kamloops | 80 | 14.5 | 470 | 66.2 | 26.6 | 1.9 | 1.9 | 2.2 | 1.2 |
| Kelowna | 190 | 17.7 | 885 | 68.9 | 23.5 | 2.2 | 1.7 | 1.8 | 1.8 |
| Nanaimo | 125 | 18.1 | 565 | 65.0 | 26.6 | 1.8 | 2.0 | 2.4 | 2.2 |
| Vancouver | 1,500 | 11.7 | 11,310 | 77.1 | 15.5 | 3.5 | 1.0 | 1.0 | 2.0 |
| Victoria | 320 | 15.1 | 1,805 | 69.9 | 21.2 | 2.6 | 1.6 | 1.7 | 3.0 |
| Non-CMA | 1,160 | 18.1 | 5,245 | 64.9 | 26.6 | 1.8 | 2.3 | 2.6 | 1.8 |
| Yukon | |||||||||
| Total | 60 | 13.6 | 380 | 66.0 | 24.8 | 2.1 | 2.2 | 2.9 | 1.9 |
| Northwest Territories | |||||||||
| Total | 40 | 10.5 | 340 | 62.9 | 26.8 | 1.4 | 2.4 | 3.5 | 3.0 |
| Nunavut | |||||||||
| Total | 35 | 18.4 | 155 | 49.9 | 35.6 | 2.9 | 2.2 | 3.4 | 6.0 |
| Canada | |||||||||
| Total | 44,155 | 11.7 | 333,030 | 73.2 | 20.9 | 1.9 | 1.4 | 1.6 | 1.1 |
|
CQI = Composite Quality Index CMA = Census Metropolitan Area Note: Counts are calculated on rounded data and may not necessarily add up to the total. Sources: Statistics Canada, Census of Population, 2021 and Study on the underclassification of children eligible for instruction in the minority official language in the 2021 Census. |
|||||||||
| Geography | Age 0 to 17 years | ||||||||
|---|---|---|---|---|---|---|---|---|---|
| Underclassification | 2021 Census | CQI | |||||||
| A | B | C | D | E | F | ||||
| number | percent | number | percent | ||||||
| Newfoundland and Labrador | |||||||||
| Total | 555 | 15.8 | 2,955 | 77.3 | 18.3 | 1.2 | 1.0 | 1.6 | 0.6 |
| St. John's | 210 | 12.4 | 1,485 | 81.1 | 15.5 | 1.1 | 0.9 | 1.1 | 0.4 |
| Non-CMA | 345 | 19.0 | 1,470 | 74.1 | 20.7 | 1.4 | 1.1 | 2.0 | 0.8 |
| Prince Edward Island | |||||||||
| Total | 325 | 10.2 | 2,865 | 79.4 | 16.4 | 1.1 | 1.2 | 1.5 | 0.4 |
| Nova Scotia | |||||||||
| Total | 1,860 | 10.0 | 16,800 | 77.3 | 18.4 | 1.1 | 1.1 | 1.6 | 0.5 |
| Halifax | 865 | 9.2 | 8,580 | 81.9 | 15.0 | 0.8 | 0.8 | 1.1 | 0.4 |
| Non-CMA | 1,000 | 10.8 | 8,220 | 72.7 | 21.9 | 1.3 | 1.4 | 2.2 | 0.5 |
| New Brunswick | |||||||||
| Total | 2,475 | 4.8 | 49,335 | 75.9 | 19.8 | 1.1 | 1.1 | 1.6 | 0.5 |
| Fredericton | 300 | 7.5 | 3,705 | 79.4 | 16.9 | 1.2 | 0.9 | 1.2 | 0.4 |
| Moncton | 715 | 5.0 | 13,720 | 78.0 | 18.3 | 0.9 | 0.9 | 1.3 | 0.6 |
| Saint John | 365 | 11.5 | 2,820 | 76.7 | 18.8 | 1.2 | 1.1 | 1.8 | 0.4 |
| Non-CMA | 1,095 | 3.6 | 29,090 | 73.3 | 21.9 | 1.2 | 1.3 | 1.8 | 0.5 |
| English non-CMA | 325 | 15.7 | 1,740 | 72.9 | 22.3 | 1.2 | 1.3 | 1.8 | 0.6 |
| French non-CMA | 765 | 2.7 | 27,325 | 74.2 | 20.9 | 1.3 | 1.4 | 1.8 | 0.4 |
| Quebec | |||||||||
| Total | 34,090 | 10.1 | 303,835 | 78.2 | 18.0 | 1.3 | 1.0 | 1.0 | 0.4 |
| Drummondville | 450 | 19.8 | 1,820 | 73.6 | 21.8 | 1.3 | 1.5 | 1.4 | 0.5 |
| Montréal | 16,595 | 7.7 | 199,355 | 81.1 | 15.7 | 1.2 | 0.8 | 0.8 | 0.3 |
| Ottawa–Gatineau | 6,015 | 5.6 | 101,340 | 84.1 | 13.4 | 0.9 | 0.6 | 0.7 | 0.4 |
| Ottawa–Gatineau (Quebec part) | 2,030 | 9.7 | 18,985 | 77.4 | 18.8 | 1.2 | 1.1 | 1.1 | 0.4 |
| Québec | 2,635 | 15.5 | 14,350 | 79.7 | 17.1 | 1.2 | 1.0 | 0.8 | 0.2 |
| Saguenay | 575 | 18.1 | 2,605 | 74.7 | 20.3 | 1.9 | 1.5 | 1.1 | 0.5 |
| Sherbrooke | 1,015 | 13.8 | 6,365 | 75.8 | 20.1 | 1.1 | 1.4 | 1.2 | 0.4 |
| Trois-Rivières | 555 | 15.8 | 2,960 | 73.7 | 21.9 | 1.1 | 1.3 | 1.3 | 0.7 |
| Non-CMA | 10,235 | 15.1 | 57,395 | 73.1 | 22.0 | 1.5 | 1.5 | 1.4 | 0.6 |
| Ontario | |||||||||
| Total | 31,335 | 8.2 | 349,875 | 82.2 | 14.4 | 1.3 | 0.7 | 1.0 | 0.5 |
| Barrie | 525 | 11.9 | 3,885 | 79.3 | 17.1 | 1.0 | 1.0 | 1.2 | 0.4 |
| Belleville–Quinte West | 365 | 15.0 | 2,075 | 72.8 | 22.5 | 1.0 | 1.3 | 1.9 | 0.5 |
| Brantford | 405 | 16.6 | 2,030 | 78.1 | 18.3 | 0.9 | 0.9 | 1.4 | 0.4 |
| Greater Sudbury | 1,150 | 7.2 | 14,830 | 74.1 | 20.9 | 1.3 | 1.4 | 1.7 | 0.6 |
| Guelph | 345 | 10.4 | 2,960 | 82.5 | 14.6 | 1.2 | 0.6 | 0.8 | 0.3 |
| Hamilton | 1,385 | 10.7 | 11,500 | 82.6 | 14.5 | 0.9 | 0.7 | 1.0 | 0.3 |
| Kingston | 440 | 9.7 | 4,095 | 77.0 | 18.9 | 0.9 | 1.1 | 1.5 | 0.6 |
| Kitchener–Cambridge–Waterloo | 1,035 | 10.6 | 8,750 | 83.2 | 13.9 | 1.0 | 0.6 | 0.9 | 0.3 |
| London | 1,310 | 10.8 | 10,810 | 80.9 | 16.0 | 0.8 | 0.8 | 1.1 | 0.4 |
| Oshawa | 900 | 10.1 | 8,050 | 81.7 | 15.1 | 1.1 | 0.8 | 1.0 | 0.3 |
| Ottawa–Gatineau | 6,015 | 5.6 | 101,340 | 84.1 | 13.4 | 0.9 | 0.6 | 0.7 | 0.4 |
| Ottawa–Gatineau (Ontario part) | 3,985 | 4.6 | 82,355 | 81.1 | 15.7 | 1.2 | 0.8 | 0.8 | 0.3 |
| Peterborough | 275 | 16.1 | 1,435 | 76.0 | 20.0 | 1.1 | 1.1 | 1.4 | 0.4 |
| St. Catharines–Niagara | 1,070 | 12.2 | 7,720 | 76.9 | 18.9 | 1.0 | 1.1 | 1.5 | 0.6 |
| Thunder Bay | 315 | 14.6 | 1,840 | 72.8 | 21.7 | 0.8 | 1.6 | 2.0 | 1.1 |
| Toronto | 8,830 | 7.8 | 103,835 | 85.4 | 11.5 | 1.5 | 0.5 | 0.7 | 0.4 |
| Windsor | 1,155 | 7.2 | 14,980 | 81.1 | 15.5 | 1.1 | 0.8 | 1.1 | 0.4 |
| Non-CMA | 7,840 | 10.2 | 68,725 | 76.5 | 18.7 | 1.4 | 1.2 | 1.6 | 0.6 |
| English non-CMA | 6,110 | 12.7 | 41,880 | 70.9 | 23.4 | 1.3 | 1.6 | 2.0 | 0.7 |
| French non-CMA | 1,740 | 6.1 | 26,840 | 77.1 | 18.2 | 1.4 | 1.2 | 1.6 | 0.6 |
| Manitoba | |||||||||
| Total | 3,550 | 10.4 | 30,475 | 78.2 | 16.5 | 1.1 | 1.0 | 1.4 | 1.9 |
| Winnipeg | 2,240 | 9.4 | 21,580 | 81.3 | 14.8 | 0.8 | 0.7 | 1.1 | 1.3 |
| Non-CMA | 1,325 | 13.0 | 8,895 | 74.1 | 18.8 | 1.4 | 1.3 | 1.7 | 2.6 |
| Saskatchewan | |||||||||
| Total | 2,085 | 11.8 | 15,540 | 76.2 | 18.2 | 1.3 | 1.2 | 1.6 | 1.4 |
| Regina | 505 | 10.6 | 4,255 | 79.8 | 15.8 | 1.3 | 1.0 | 1.3 | 0.8 |
| Saskatoon | 585 | 9.7 | 5,440 | 80.9 | 15.1 | 1.2 | 0.9 | 1.1 | 0.8 |
| Non-CMA | 985 | 14.4 | 5,845 | 72.3 | 20.9 | 1.3 | 1.5 | 2.0 | 2.0 |
| Alberta | |||||||||
| Total | 7,910 | 10.5 | 67,145 | 81.3 | 15.0 | 1.2 | 0.8 | 1.1 | 0.6 |
| Calgary | 2,455 | 9.3 | 23,980 | 84.7 | 12.4 | 1.2 | 0.6 | 0.7 | 0.4 |
| Edmonton | 2,945 | 10.5 | 25,140 | 81.9 | 14.7 | 1.2 | 0.8 | 1.0 | 0.5 |
| Lethbridge | 150 | 12.2 | 1,075 | 81.0 | 15.5 | 0.9 | 0.8 | 1.1 | 0.5 |
| Red Deer | 195 | 12.8 | 1,325 | 76.0 | 19.9 | 1.0 | 1.1 | 1.5 | 0.6 |
| Non-CMA | 2,155 | 12.1 | 15,625 | 76.9 | 18.2 | 1.3 | 1.1 | 1.5 | 1.1 |
| British Columbia | |||||||||
| Total | 7,200 | 11.5 | 55,575 | 80.1 | 14.9 | 2.2 | 0.9 | 1.0 | 0.9 |
| Abbotsford–Mission | 390 | 16.5 | 1,975 | 80.1 | 13.7 | 3.3 | 1.1 | 1.1 | 0.8 |
| Chilliwack | 200 | 15.2 | 1,120 | 77.6 | 17.1 | 1.6 | 1.1 | 1.6 | 1.0 |
| Kamloops | 165 | 11.5 | 1,270 | 76.0 | 19.6 | 1.2 | 1.0 | 1.5 | 0.7 |
| Kelowna | 350 | 12.7 | 2,400 | 78.3 | 17.1 | 1.7 | 1.0 | 1.1 | 0.8 |
| Nanaimo | 290 | 16.1 | 1,515 | 74.4 | 20.0 | 1.6 | 1.2 | 1.6 | 1.1 |
| Vancouver | 2,905 | 9.5 | 27,520 | 83.6 | 11.7 | 2.5 | 0.7 | 0.6 | 0.9 |
| Victoria | 635 | 11.5 | 4,895 | 79.1 | 15.6 | 2.0 | 0.9 | 1.0 | 1.2 |
| Non-CMA | 2,255 | 13.2 | 14,880 | 74.2 | 20.1 | 1.5 | 1.3 | 1.7 | 1.1 |
| Yukon | |||||||||
| Total | 135 | 10.5 | 1,155 | 75.5 | 19.1 | 1.3 | 1.1 | 1.7 | 1.3 |
| Northwest Territories | |||||||||
| Total | 105 | 8.6 | 1,110 | 71.4 | 22.3 | 1.1 | 1.5 | 2.1 | 1.5 |
| Nunavut | |||||||||
| Total | 115 | 17.7 | 535 | 63.5 | 27.3 | 2.2 | 1.5 | 2.2 | 3.4 |
| Canada | |||||||||
| Total | 91,740 | 9.3 | 897,200 | 80.2 | 15.9 | 1.4 | 0.9 | 1.1 | 0.6 |
|
CQI = Composite Quality Index CMA = Census Metropolitan Area Note: Counts are calculated on rounded data and may not necessarily add up to the total. Sources: Statistics Canada, Census of Population, 2021 and Study on the underclassification of children eligible for instruction in the minority official language in the 2021 Census. |
|||||||||
- Date modified: