
Coverage Technical Report, Census of Population, 2016
11. Historical estimates of population coverage error
11.1 Estimates
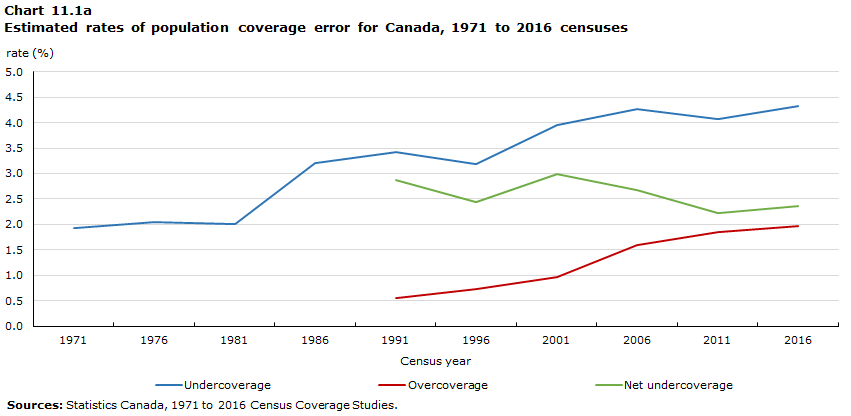
This section presents historical estimates of population coverage error. Chart 11.1a shows the estimated population undercoverage rate for the 1971 Census to the 2016 Census, as well as the estimated population overcoverage rate and the estimated population net undercoverage rate for the 1991 Census to the 2016 Census. Overcoverage and net undercoverage begin in 1991 because the overcoverage rate was first estimated for the 1991 Census, after an experimental study was conducted for the 1986 Census.
Data table for Chart 11.1a
| Census year | Estimated undercoverage rate | Estimated overcoverage rate | Estimated net undercoverage rate |
|---|---|---|---|
| rate (%) | |||
| 1971 | 1.93 | Note ..: not available for a specific reference period | Note ..: not available for a specific reference period |
| 1976 | 2.04 | Note ..: not available for a specific reference period | Note ..: not available for a specific reference period |
| 1981 | 2.01 | Note ..: not available for a specific reference period | Note ..: not available for a specific reference period |
| 1986 | 3.21 | Note ..: not available for a specific reference period | Note ..: not available for a specific reference period |
| 1991 | 3.43 | 0.56 | 2.87 |
| 1996 | 3.18 | 0.74 | 2.44 |
| 2001 | 3.95 | 0.96 | 2.99 |
| 2006 | 4.26 | 1.59 | 2.67 |
| 2011 | 4.07 | 1.85 | 2.22 |
| 2016 | 4.32 | 1.96 | 2.36 |
|
.. not available for a specific reference period Sources: Statistics Canada, 1971 to 2016 Census Coverage Studies. |
|||
Population coverage error is a major data quality concern; undercoverage has more than doubled since 1981, and overcoverage is two-and-a-half times higher than it was in 1996. Changes in net undercoverage from census to census reflect changes in undercoverage and overcoverage, which in turn reflect changes in the demographic situation, in the living arrangements of Canadians, in census methodology, and in the methodology of the coverage studies. The last issue is discussed in Section 11.2.
As shown in Chart 11.1a, the undercoverage rate increased slightly in 2016, while the overcoverage rate changed very little. The undercoverage rate changed little in the 1971 to 1981 censuses, before increasing 1.2 percentage points in the 1986 Census. It held relatively steady from 1986 to 1996, then increased again by 0.78 percentage points in 2001. It remained fairly stable again in the censuses from 2001 to 2016, with alternating small increases and declines. As mentioned, some of these fluctuations, including the increase observed in 2016, can be explained by the improvements made to the coverage study methodology described in Section 11.2.
The overcoverage rate has increased in each census since it was first measured. The largest recorded increase in the overcoverage rate was from 0.96% to 1.59% between 2001 and 2006. In 2016, the rate peaked at 1.96%, although the increase from 2011 was not statistically significant.
In 2016, net undercoverage increased slightly, following declines in the previous two censuses, but it was still the second lowest rate since the inclusion of net undercoverage in the census, and the increase over 2011 was not statistically significant.
An examination of undercoverage since the 1981 Census shows that the increase observed in the 1986 Census led to the creation of the Address Register (AR) for the 1991 Census. The AR provided a separate list of urban dwellings that should have been enumerated. For the 1996 Census, the use of enumerators instead of self-enumeration in some central parts of large cities reduced undercoverage. In addition, moving Census Day from early June to mid-May helped to control undercoverage because people were more likely to be at home and less likely to be moving. In 2006, mailing out the questionnaires in urban areas reduced the number of employees required for collection. The introduction of online questionnaires also reduced data capture problems. In 2011, the adoption of wave methodology made it possible to target census follow-up activities more effectively, and a sharp increase in online responses further reduced data capture problems. The elimination of the long-form questionnaire probably resulted in a slight decrease in the census non-response rate. In 2016, the reintroduction of the mandatory long-form questionnaire, the upward trend in online responses, and the movement of public support for the census reduced the census non-response rate and improved the overall quality of the census.
Estimates of undercoverage are presented in Table 11.1a and Table 11.1b. Note that 1971 is not included in Table 11.1b because estimates were produced for different age groups for persons older than 24.
| Provinces and territories | 1971 | 1976 | 1981 | 1986 | 1991 | 1996 | 2001 | 2006 | 2011 | 2016 | ||||||||||
|---|---|---|---|---|---|---|---|---|---|---|---|---|---|---|---|---|---|---|---|---|
| Estimated rate |
Standard error |
Estimated rate |
Standard error |
Estimated rate |
Standard error |
Estimated rate |
Standard error |
Estimated rate |
Standard error |
Estimated rate |
Standard error |
Estimated rate |
Standard error |
Estimated rate |
Standard error |
Estimated rate |
Standard error |
Estimated rate |
Standard error |
|
| percent | ||||||||||||||||||||
| Canada | 1.93 | 0.09 | 2.04 | 0.10 | 2.01 | 0.09 | 3.21 | 0.13 | 3.43 | 0.12 | 3.18 | 0.09 | 3.95 | 0.13 | 4.26 | 0.17 | 4.07 | 0.16 | 4.32 | 0.11 |
| Newfoundland and Labrador | 2.25 | 0.72 | 1.10 | 0.39 | 1.74 | 0.45 | 1.92 | 0.33 | 2.47 | 0.30 | 2.45 | 0.29 | 2.43 | 0.32 | 2.62 | 0.54 | 3.70 | 0.53 | 3.94 | 0.36 |
| Prince Edward Island | 1.23 | 1.13 | 0.38 | 0.25 | 1.17 | 0.54 | 2.14 | 0.80 | 1.67 | 0.23 | 1.76 | 0.28 | 1.89 | 0.53 | 3.04 | 0.52 | 3.90 | 0.62 | 4.01 | 0.57 |
| Nova Scotia | 1.33 | 0.45 | 0.86 | 0.34 | 1.05 | 0.34 | 2.15 | 0.34 | 2.25 | 0.36 | 2.70 | 0.27 | 3.44 | 0.41 | 4.02 | 0.54 | 4.04 | 0.54 | 3.70 | 0.30 |
| New Brunswick | 1.65 | 0.56 | 2.16 | 0.37 | 1.81 | 0.30 | 2.71 | 0.33 | 3.71 | 0.42 | 2.49 | 0.28 | 3.57 | 0.42 | 3.56 | 0.43 | 2.64 | 0.43 | 4.24 | 0.34 |
| Quebec | 2.10 | 0.19 | 2.95 | 0.25 | 1.91 | 0.21 | 2.91 | 0.31 | 3.18 | 0.20 | 2.46 | 0.18 | 2.93 | 0.26 | 2.46 | 0.32 | 2.99 | 0.29 | 2.57 | 0.21 |
| Ontario | 1.68 | 0.12 | 1.52 | 0.17 | 1.94 | 0.14 | 3.43 | 0.19 | 4.23 | 0.28 | 3.40 | 0.18 | 4.56 | 0.25 | 5.18 | 0.34 | 4.47 | 0.32 | 4.63 | 0.22 |
| Manitoba | 1.13 | 0.38 | 1.07 | 0.33 | 0.98 | 0.35 | 2.94 | 0.40 | 2.31 | 0.36 | 2.55 | 0.29 | 3.49 | 0.43 | 4.32 | 0.57 | 3.11 | 0.48 | 3.95 | 0.35 |
| Saskatchewan | 1.00 | 0.37 | 1.33 | 0.34 | 0.99 | 0.37 | 2.38 | 0.37 | 2.15 | 0.32 | 3.30 | 0.32 | 3.18 | 0.37 | 3.81 | 0.50 | 4.43 | 0.57 | 4.99 | 0.37 |
| Alberta | 2.55 | 0.44 | 1.49 | 0.26 | 2.54 | 0.36 | 3.00 | 0.32 | 2.51 | 0.27 | 2.99 | 0.24 | 3.18 | 0.33 | 4.74 | 0.49 | 5.11 | 0.45 | 4.51 | 0.30 |
| British Columbia | 2.89 | 0.39 | 3.13 | 0.31 | 3.16 | 0.33 | 4.48 | 0.36 | 3.42 | 0.24 | 4.58 | 0.24 | 5.30 | 0.34 | 4.83 | 0.41 | 4.31 | 0.41 | 6.31 | 0.31 |
| Yukon | Note ..: not available for a specific reference period | Note ..: not available for a specific reference period | Note ..: not available for a specific reference period | Note ..: not available for a specific reference period | Note ..: not available for a specific reference period | Note ..: not available for a specific reference period | Note ..: not available for a specific reference period | Note ..: not available for a specific reference period | 4.12 | 0.58 | 3.92 | 0.51 | 5.59 | 1.16 | 7.23 | 0.64 | 6.30 | 0.81 | 8.42 | 0.45 |
| Northwest Territories | Note ..: not available for a specific reference period | Note ..: not available for a specific reference period | Note ..: not available for a specific reference period | Note ..: not available for a specific reference period | Note ..: not available for a specific reference period | Note ..: not available for a specific reference period | Note ..: not available for a specific reference period | Note ..: not available for a specific reference period | 5.73 | 0.57 | 4.28 | 0.67 | 9.10 | 0.80 | 5.74 | 0.57 | 5.99 | 0.69 | 7.83 | 0.53 |
| Nunavut | Note ...: not applicable | Note ...: not applicable | Note ...: not applicable | Note ...: not applicable | Note ...: not applicable | Note ...: not applicable | Note ...: not applicable | Note ...: not applicable | Note ...: not applicable | Note ...: not applicable | 6.54 | 0.63 | 5.07 | 1.39 | 5.55 | 0.60 | 7.39 | 1.65 | 4.25 | 0.59 |
|
.. not available for a specific reference period ... not applicable
|
||||||||||||||||||||
| Sex and age group | 1976 | 1981 | 1986 | 1991 | 1996 | 2001 | 2006 | 2011 | 2016 | |||||||||
|---|---|---|---|---|---|---|---|---|---|---|---|---|---|---|---|---|---|---|
| Estimated rate |
Standard error |
Estimated rate |
Standard error |
Estimated rate |
Standard error |
Estimated rate |
Standard error |
Estimated rate |
Standard error |
Estimated rate |
Standard error |
Estimated rate |
Standard error |
Estimated rate |
Standard error |
Estimated rate |
Standard error |
|
| percent | ||||||||||||||||||
| Both sexes | 2.04 | 0.10 | 2.01 | 0.09 | 3.21 | 0.13 | 3.43 | 0.12 | 3.18 | 0.09 | 3.95 | 0.13 | 4.26 | 0.17 | 4.07 | 0.16 | 4.32 | 0.11 |
| 0 to 4 years | 2.31 | 0.28 | 1.21 | 0.22 | 2.14 | 0.49 | 3.55 | 0.49 | 2.89 | 0.36 | 4.42 | 0.71 | 4.07 | 0.65 | 3.36 | 0.62 | 3.79 | 0.51 |
| 5 to 14 years | 1.20 | 0.16 | 1.23 | 0.21 | 2.08 | 0.26 | 2.49 | 0.27 | 1.45 | 0.14 | 2.90 | 0.38 | 3.10 | 0.46 | 2.61 | 0.42 | 2.94 | 0.37 |
| 15 to 17 yearsTable 11.1b Note 2 | 1.99 | 0.38 | 2.96 | 0.52 | 3.58 | 0.60 | 3.75 | 0.42 | 3.48 | 0.42 | 4.36 | 0.53 | 1.56 | 0.60 | 3.83 | 0.85 | 4.35 | 0.78 |
| 18 to 19 years | Note ..: not available for a specific reference period | Note ..: not available for a specific reference period | Note ..: not available for a specific reference period | Note ..: not available for a specific reference period | Note ..: not available for a specific reference period | Note ..: not available for a specific reference period | Note ..: not available for a specific reference period | Note ..: not available for a specific reference period | Note ..: not available for a specific reference period | Note ..: not available for a specific reference period | Note ..: not available for a specific reference period | Note ..: not available for a specific reference period | 8.86 | 1.58 | 6.28 | 0.93 | 7.71 | 1.25 |
| 20 to 24 years | 5.31 | 0.38 | 5.51 | 0.29 | 8.66 | 0.46 | 8.18 | 0.52 | 8.00 | 0.34 | 9.85 | 0.62 | 10.50 | 0.74 | 9.60 | 0.69 | 9.64 | 0.58 |
| 25 to 34 years | 2.85 | 0.28 | 2.31 | 0.28 | 4.51 | 0.35 | 5.65 | 0.35 | 5.81 | 0.29 | 8.07 | 0.36 | 9.43 | 0.56 | 8.96 | 0.48 | 8.60 | 0.42 |
| 35 to 44 years | 1.54 | 0.26 | 2.20 | 0.26 | 2.32 | 0.31 | 2.84 | 0.29 | 2.78 | 0.24 | 4.04 | 0.33 | 5.36 | 0.50 | 4.66 | 0.45 | 5.07 | 0.41 |
| 45 to 54 years | 1.22 | 0.33 | 0.81 | 0.23 | 1.58 | 0.29 | 1.61 | 0.27 | 1.90 | 0.21 | 1.79 | 0.29 | 2.64 | 0.43 | 2.95 | 0.42 | 3.86 | 0.39 |
| 55 to 64 years | 0.92 | 0.20 | 0.91 | 0.29 | 2.06 | 0.31 | 1.69 | 0.28 | 2.23 | 0.34 | 1.22 | 0.37 | 0.95 | 0.53 | 1.02 | 0.41 | 2.21 | 0.42 |
| 65 years and older | 1.20 | 0.25 | 0.71 | 0.30 | 1.76 | 0.31 | 1.51 | 0.28 | 1.52 | 0.26 | 1.29 | 0.34 | 0.21 | 0.40 | 1.19 | 0.45 | 0.77 | 0.29 |
| Males | 2.46 | 0.17 | 2.37 | 0.13 | 3.75 | 0.16 | 3.95 | 0.16 | 3.89 | 0.14 | 4.90 | 0.19 | 5.51 | 0.26 | 5.07 | 0.24 | 5.27 | 0.18 |
| 0 to 4 years | 2.53 | 0.46 | 1.32 | 0.33 | 2.22 | 0.67 | 2.79 | 0.58 | 2.56 | 0.47 | 3.36 | 0.89 | 4.24 | 0.95 | 3.14 | 0.82 | 4.22 | 0.68 |
| 5 to 14 years | 1.14 | 0.21 | 1.27 | 0.29 | 1.98 | 0.32 | 2.32 | 0.34 | 1.46 | 0.24 | 2.38 | 0.49 | 3.04 | 0.64 | 3.00 | 0.62 | 2.35 | 0.54 |
| 15 to 17 yearsTable 11.1b Note 2 | 1.93 | 0.48 | 3.12 | 0.68 | 4.09 | 0.74 | 3.55 | 0.60 | 3.68 | 0.43 | 5.49 | 0.80 | 1.88 | 0.88 | 4.31 | 1.13 | 4.55 | 1.11 |
| 18 to 19 years | Note ..: not available for a specific reference period | Note ..: not available for a specific reference period | Note ..: not available for a specific reference period | Note ..: not available for a specific reference period | Note ..: not available for a specific reference period | Note ..: not available for a specific reference period | Note ..: not available for a specific reference period | Note ..: not available for a specific reference period | Note ..: not available for a specific reference period | Note ..: not available for a specific reference period | Note ..: not available for a specific reference period | Note ..: not available for a specific reference period | 10.06 | 2.45 | 5.42 | 1.19 | 7.38 | 1.82 |
| 20 to 24 years | 5.99 | 0.52 | 6.03 | 0.48 | 10.36 | 0.57 | 8.98 | 0.81 | 9.48 | 0.50 | 11.68 | 0.92 | 12.21 | 1.12 | 9.37 | 0.88 | 11.46 | 0.88 |
| 25 to 34 years | 3.64 | 0.46 | 2.70 | 0.44 | 5.43 | 0.45 | 7.28 | 0.56 | 7.74 | 0.42 | 10.67 | 0.55 | 11.42 | 0.86 | 10.54 | 0.73 | 10.44 | 0.63 |
| 35 to 44 years | 2.33 | 0.48 | 3.42 | 0.40 | 3.29 | 0.51 | 3.65 | 0.41 | 3.94 | 0.39 | 5.71 | 0.51 | 7.77 | 0.79 | 6.34 | 0.68 | 6.24 | 0.63 |
| 45 to 54 years | 1.63 | 0.41 | 1.21 | 0.38 | 1.95 | 0.52 | 2.05 | 0.45 | 2.12 | 0.27 | 2.50 | 0.44 | 4.14 | 0.69 | 4.69 | 0.66 | 5.16 | 0.59 |
| 55 to 64 years | 1.28 | 0.34 | 0.91 | 0.40 | 1.88 | 0.47 | 2.04 | 0.44 | 2.50 | 0.54 | 1.35 | 0.54 | 2.13 | 0.77 | 2.58 | 0.69 | 3.11 | 0.67 |
| 65 years and older | 1.90 | 0.44 | 0.69 | 0.47 | 1.57 | 0.50 | 1.41 | 0.50 | 1.64 | 0.45 | 1.50 | 0.53 | -0.05 | 0.56 | 1.32 | 0.60 | 1.23 | 0.41 |
| Females | 1.61 | 0.10 | 1.65 | 0.12 | 2.68 | 0.17 | 2.93 | 0.17 | 2.49 | 0.12 | 3.02 | 0.18 | 3.04 | 0.23 | 3.08 | 0.22 | 3.39 | 0.18 |
| 0 to 4 years | 2.07 | 0.36 | 1.10 | 0.33 | 2.06 | 0.62 | 4.35 | 0.71 | 3.24 | 0.55 | 5.50 | 1.14 | 3.88 | 0.92 | 3.59 | 0.95 | 3.34 | 0.87 |
| 5 to 14 years | 1.26 | 0.27 | 1.19 | 0.31 | 2.20 | 0.33 | 2.65 | 0.39 | 1.45 | 0.22 | 3.44 | 0.58 | 3.17 | 0.66 | 2.20 | 0.57 | 3.56 | 0.56 |
| 15 to 17 yearsTable 11.1b Note 2 | 2.05 | 0.51 | 2.80 | 0.73 | 3.05 | 0.76 | 3.96 | 0.54 | 3.28 | 0.55 | 3.13 | 0.69 | 1.23 | 0.83 | 3.31 | 1.28 | 4.13 | 1.06 |
| 18 to 19 years | Note ..: not available for a specific reference period | Note ..: not available for a specific reference period | Note ..: not available for a specific reference period | Note ..: not available for a specific reference period | Note ..: not available for a specific reference period | Note ..: not available for a specific reference period | Note ..: not available for a specific reference period | Note ..: not available for a specific reference period | Note ..: not available for a specific reference period | Note ..: not available for a specific reference period | Note ..: not available for a specific reference period | Note ..: not available for a specific reference period | 7.58 | 1.96 | 7.17 | 1.45 | 8.07 | 1.77 |
| 20 to 24 years | 4.62 | 0.48 | 4.98 | 0.43 | 6.89 | 0.72 | 7.36 | 0.71 | 6.45 | 0.48 | 7.91 | 0.84 | 8.70 | 0.98 | 9.83 | 1.07 | 7.66 | 0.77 |
| 25 to 34 years | 2.03 | 0.38 | 1.92 | 0.32 | 3.59 | 0.45 | 3.98 | 0.37 | 3.84 | 0.40 | 5.41 | 0.46 | 7.43 | 0.73 | 7.37 | 0.63 | 6.71 | 0.56 |
| 35 to 44 years | 0.72 | 0.24 | 0.93 | 0.31 | 1.33 | 0.32 | 2.01 | 0.35 | 1.62 | 0.28 | 2.35 | 0.43 | 2.90 | 0.61 | 2.99 | 0.58 | 3.93 | 0.53 |
| 45 to 54 years | 0.81 | 0.38 | 0.41 | 0.26 | 1.20 | 0.35 | 1.16 | 0.34 | 1.68 | 0.33 | 1.09 | 0.37 | 1.13 | 0.51 | 1.21 | 0.52 | 2.56 | 0.55 |
| 55 to 64 years | 0.58 | 0.25 | 0.92 | 0.34 | 2.23 | 0.50 | 1.35 | 0.33 | 1.97 | 0.40 | 1.09 | 0.52 | -0.22 | 0.73 | -0.52 | 0.44 | 1.32 | 0.50 |
| 65 years and older | 0.64 | 0.38 | 0.71 | 0.42 | 1.89 | 0.44 | 1.58 | 0.36 | 1.43 | 0.32 | 1.13 | 0.45 | 0.40 | 0.56 | 1.08 | 0.66 | 0.39 | 0.42 |
.. not available for a specific reference period
|
||||||||||||||||||
The following can be observed from these tables:
Undercoverage is usually higher in the three territories, except in Nunavut, where the undercoverage rate was close to the national rate in 2016. Among the provinces, undercoverage is generally higher in British Columbia and Ontario. However, in recent censuses, the undercoverage rate in Alberta and Saskatchewan has been close to Ontario’s rate, and has even exceeded it a few times. Between 1971 and 2001, British Columbia was the province with the highest undercoverage rate in every census, except in 1991, when Ontario had the highest rate. Ontario had the highest rate in 2006 as well, while Alberta had it in 2011. In 2016, British Columbia had the highest rate again, followed by Saskatchewan. Undercoverage rates for Quebec and the Atlantic provinces tend to be lower than the national rate.
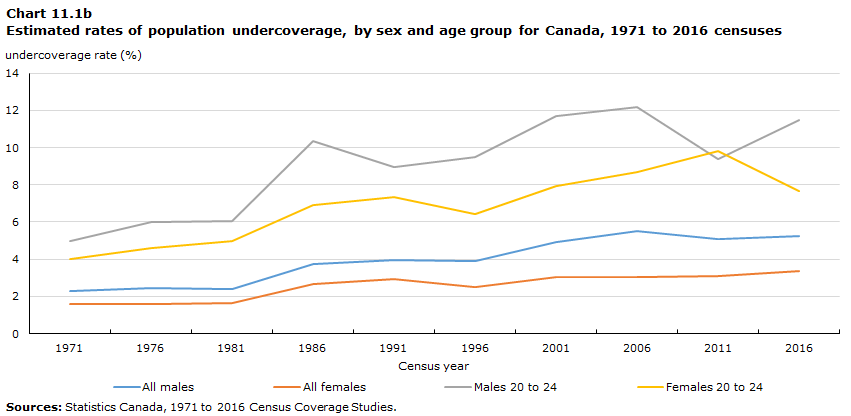
Undercoverage was higher for young adults and higher for males than for females. Thus, there are two persistent demographic trends. First, undercoverage for males is higher than undercoverage for females. Second, undercoverage is higher for young adults, especially those who have never been married, regardless of sex (Dolson 2012). As shown in Chart 11.1b, undercoverage for males was higher than undercoverage for females for every census since 1971 (increasing from 2.27% to 5.27% for males and from 1.59% to 3.39% for females). Chart 11.1b also shows that undercoverage for young men aged 20 to 24 was higher than undercoverage for all males. This was also the case for women aged 20 to 24, but the rate for women aged 20 to 24 was lower than the rate for men in the same age group in every census except 2011, when the rates were 9.83% and 9.37%, respectively. The undercoverage rate for young women peaked at 9.83% in 2011 and then dropped to 7.66% in 2016. In contrast, the rate for young men was at its lowest point in 20 years in 2011 and increased 2.09 percentage points in 2016. The undercoverage rates for adults aged 25 to 34 were also high. The undercoverage rate was higher for young adults, partly because of their less stable living arrangements. Young adults are more likely to change their living arrangements than older adults or children because they are moving away from home to work or to attend a postsecondary institution, or they are moving in with friends or spouses.
Data table for Chart 11.1b
| Census year | All males | All females | Males 20 to 24 | Females 20 to 24 |
|---|---|---|---|---|
| undercoverage rate (%) | ||||
| 1971 | 2.27 | 1.59 | 4.97 | 4.01 |
| 1976 | 2.46 | 1.61 | 5.99 | 4.62 |
| 1981 | 2.37 | 1.65 | 6.03 | 4.98 |
| 1986 | 3.75 | 2.68 | 10.36 | 6.89 |
| 1991 | 3.95 | 2.93 | 8.98 | 7.36 |
| 1996 | 3.89 | 2.49 | 9.48 | 6.45 |
| 2001 | 4.90 | 3.02 | 11.68 | 7.91 |
| 2006 | 5.51 | 3.04 | 12.21 | 8.71 |
| 2011 | 5.07 | 3.08 | 9.37 | 9.83 |
| 2016 | 5.27 | 3.39 | 11.46 | 7.66 |
| Sources: Statistics Canada, 1971 to 2016 Census Coverage Studies. | ||||
Estimates of overcoverage rates are presented in Table 11.1c and Table 11.1d.
| Provinces and territories | 1991 | 1996 | 2001 | 2006 | 2011 | 2016 | ||||||
|---|---|---|---|---|---|---|---|---|---|---|---|---|
| Estimated rate |
Standard error |
Estimated rate |
Standard error |
Estimated rate |
Standard error |
Estimated rate |
Standard error |
Estimated rate |
Standard error |
Estimated rate |
Standard error |
|
| percent | ||||||||||||
| Canada | 0.56 | 0.04 | 0.74 | 0.04 | 0.96 | 0.05 | 1.59 | 0.01 | 1.85 | 0.02 | 1.96 | 0.04 |
| Newfoundland and Labrador | 0.48 | 0.09 | 0.77 | 0.12 | 0.63 | 0.10 | 1.63 | 0.05 | 1.76 | 0.04 | 2.09 | 0.07 |
| Prince Edward Island | 0.74 | 0.15 | 0.91 | 0.14 | 0.92 | 0.18 | 1.66 | 0.06 | 1.54 | 0.04 | 1.65 | 0.07 |
| Nova Scotia | 0.36 | 0.09 | 0.47 | 0.07 | 0.81 | 0.14 | 1.40 | 0.03 | 1.72 | 0.04 | 1.81 | 0.07 |
| New Brunswick | 0.46 | 0.09 | 0.60 | 0.10 | 0.89 | 0.19 | 1.41 | 0.03 | 2.12 | 0.05 | 2.18 | 0.08 |
| Quebec | 0.51 | 0.07 | 0.85 | 0.08 | 1.03 | 0.10 | 1.66 | 0.02 | 2.07 | 0.03 | 2.15 | 0.12 |
| Ontario | 0.59 | 0.07 | 0.67 | 0.07 | 0.88 | 0.09 | 1.49 | 0.02 | 1.67 | 0.04 | 1.87 | 0.08 |
| Manitoba | 0.45 | 0.11 | 0.88 | 0.15 | 0.80 | 0.15 | 1.42 | 0.04 | 1.35 | 0.04 | 1.51 | 0.06 |
| Saskatchewan | 0.35 | 0.08 | 0.55 | 0.11 | 1.06 | 0.20 | 1.53 | 0.04 | 1.65 | 0.04 | 1.91 | 0.14 |
| Alberta | 0.51 | 0.09 | 0.59 | 0.10 | 0.89 | 0.13 | 1.47 | 0.02 | 1.70 | 0.05 | 1.74 | 0.06 |
| British Columbia | 0.68 | 0.10 | 0.89 | 0.09 | 1.26 | 0.12 | 1.96 | 0.03 | 2.28 | 0.05 | 2.24 | 0.07 |
| Yukon | 0.29 | 0.07 | 0.70 | 0.17 | 0.86 | 0.16 | 1.62 | 0.08 | 2.45 | 0.05 | 2.22 | 0.08 |
| Northwest Territories | 0.29 | 0.07 | 1.32 | 0.22 | 1.00 | 0.11 | 1.98 | 0.08 | 1.44 | 0.11 | 1.25 | 0.06 |
| Nunavut | Note ...: not applicable | Note ...: not applicable | 0.99 | 0.22 | 0.59 | 0.10 | 1.44 | 0.07 | 1.17 | 0.07 | 1.73 | 0.07 |
... not applicable
|
||||||||||||
| Sex and age groups | 1996 | 2001 | 2006 | 2011 | 2016 | |||||
|---|---|---|---|---|---|---|---|---|---|---|
| Estimated rate | Standard error | Estimated rate | Standard error | Estimated rate | Standard error | Estimated rate | Standard error | Estimated rate | Standard error | |
| percent | ||||||||||
| Both sexes | 0.74 | 0.04 | 0.96 | 0.05 | 1.59 | 0.01 | 1.85 | 0.02 | 1.96 | 0.04 |
| 0 to 4 years | 0.61 | 0.10 | 0.96 | 0.18 | 1.35 | 0.07 | 1.61 | 0.10 | 1.76 | 0.19 |
| 5 to 14 years | 0.96 | 0.09 | 1.52 | 0.15 | 2.24 | 0.07 | 2.79 | 0.10 | 3.49 | 0.20 |
| 15 to 17 yearsTable 11.1d Note 3 | 1.24 | 0.15 | 1.85 | 0.26 | 2.33 | 0.14 | 2.98 | 0.23 | 3.25 | 0.35 |
| 18 to 19 years | Note ..: not available for a specific reference period | Note ..: not available for a specific reference period | Note ..: not available for a specific reference period | Note ..: not available for a specific reference period | 2.65 | 0.17 | 3.37 | 0.27 | 3.27 | 0.40 |
| 20 to 24 years | 2.44 | 0.28 | 2.66 | 0.32 | 2.88 | 0.11 | 3.11 | 0.13 | 3.51 | 0.26 |
| 25 to 34 years | 0.66 | 0.08 | 0.92 | 0.09 | 1.43 | 0.06 | 1.69 | 0.08 | 2.19 | 0.17 |
| 35 to 44 years | 0.38 | 0.06 | 0.49 | 0.06 | 1.05 | 0.05 | 1.23 | 0.06 | 1.12 | 0.11 |
| 45 to 54 years | 0.48 | 0.11 | 0.39 | 0.04 | 1.13 | 0.05 | 1.36 | 0.06 | 1.18 | 0.10 |
| 55 to 64 years | 0.52 | 0.11 | 0.38 | 0.05 | 1.24 | 0.06 | 1.50 | 0.07 | 1.44 | 0.14 |
| 65 years and older | 0.36 | 0.07 | 0.77 | 0.21 | 1.60 | 0.06 | 1.64 | 0.08 | 1.55 | 0.10 |
| Males | 0.70 | 0.04 | 0.92 | 0.06 | 1.62 | 0.02 | 1.86 | 0.04 | 1.95 | 0.07 |
| 0 to 4 years | 0.52 | 0.09 | 0.69 | 0.07 | 1.35 | 0.09 | 1.65 | 0.13 | 1.56 | 0.24 |
| 5 to 14 years | 0.99 | 0.15 | 1.59 | 0.21 | 2.25 | 0.10 | 2.77 | 0.14 | 3.50 | 0.28 |
| 15 to 17 yearsTable 11.1d Note 3 | 1.12 | 0.24 | 1.45 | 0.31 | 2.37 | 0.20 | 3.04 | 0.27 | 4.14 | 0.58 |
| 18 to 19 years | Note ..: not available for a specific reference period | Note ..: not available for a specific reference period | Note ..: not available for a specific reference period | Note ..: not available for a specific reference period | 2.28 | 0.21 | 3.06 | 0.33 | 2.56 | 0.44 |
| 20 to 24 years | 2.34 | 0.34 | 2.44 | 0.45 | 2.75 | 0.15 | 3.03 | 0.19 | 3.27 | 0.37 |
| 25 to 34 years | 0.65 | 0.11 | 1.03 | 0.14 | 1.51 | 0.08 | 1.75 | 0.11 | 2.29 | 0.24 |
| 35 to 44 years | 0.38 | 0.06 | 0.46 | 0.06 | 1.10 | 0.06 | 1.26 | 0.09 | 1.21 | 0.16 |
| 45 to 54 years | 0.35 | 0.07 | 0.34 | 0.03 | 1.16 | 0.07 | 1.32 | 0.09 | 1.17 | 0.13 |
| 55 to 64 years | 0.37 | 0.12 | 0.33 | 0.04 | 1.30 | 0.09 | 1.54 | 0.11 | 1.22 | 0.20 |
| 65 years and older | 0.33 | 0.02 | 0.74 | 0.21 | 1.69 | 0.10 | 1.68 | 0.14 | 1.47 | 0.15 |
| Females | 0.77 | 0.06 | 1.00 | 0.08 | 1.56 | 0.01 | 1.83 | 0.04 | 1.98 | 0.07 |
| 0 to 4 years | 0.69 | 0.18 | 1.25 | 0.36 | 1.35 | 0.10 | 1.57 | 0.15 | 1.96 | 0.31 |
| 5 to 14 years | 0.92 | 0.14 | 1.44 | 0.21 | 2.23 | 0.10 | 2.81 | 0.15 | 3.49 | 0.29 |
| 15 to 17 yearsTable 11.1d Note 3 | 1.36 | 0.29 | 2.27 | 0.43 | 2.28 | 0.19 | 2.93 | 0.38 | 2.32 | 0.38 |
| 18 to 19 years | Note ..: not available for a specific reference period | Note ..: not available for a specific reference period | Note ..: not available for a specific reference period | Note ..: not available for a specific reference period | 3.04 | 0.28 | 3.69 | 0.43 | 4.02 | 0.68 |
| 20 to 24 years | 2.55 | 0.46 | 2.89 | 0.46 | 3.01 | 0.17 | 3.19 | 0.18 | 3.77 | 0.38 |
| 25 to 34 years | 0.66 | 0.11 | 0.81 | 0.12 | 1.35 | 0.08 | 1.63 | 0.11 | 2.08 | 0.23 |
| 35 to 44 years | 0.37 | 0.10 | 0.53 | 0.11 | 0.99 | 0.06 | 1.20 | 0.10 | 1.04 | 0.16 |
| 45 to 54 years | 0.61 | 0.20 | 0.43 | 0.07 | 1.11 | 0.06 | 1.39 | 0.09 | 1.19 | 0.14 |
| 55 to 64 years | 0.66 | 0.19 | 0.42 | 0.09 | 1.18 | 0.07 | 1.46 | 0.10 | 1.66 | 0.20 |
| 65 years and older | 0.38 | 0.11 | 0.80 | 0.33 | 1.53 | 0.08 | 1.60 | 0.10 | 1.63 | 0.14 |
.. not available for a specific reference period
|
||||||||||
The following can be observed from these tables:
Overcoverage is consistently higher for British Columbia than for the other provinces. British Columbia has been the province with the highest rate of population overcoverage for the past five censuses. Of the three territories, Yukon had the highest overcoverage rate for the second consecutive census, whereas the Northwest Territories had the highest rate from 1996 to 2006. Overcoverage was up in the majority of provinces and territories in 2016, but the increases were generally less pronounced than in 2011. The Northwest Territories and Manitoba had the lowest rates, at 1.25% and 1.51%, respectively. They also had two of the three lowest rates in 2011.
Overcoverage was more common for school-aged children and young adults. In addition, the 5 to 17 and 18 to 24 age groups had higher overcoverage rates. For school-aged children, this situation was largely due to the fact that children whose parents do not live together are often enumerated by both parents. Overcoverage for young adults is probably attributable to the same less stable living arrangements that can also lead to undercoverage. Nationally, overcoverage rates were above 3% for young adults (18 to 24) and for youth aged 5 to 17. The 5 to 14 age group saw the largest increase in overcoverage relative to 2011.
11.2 Changes in the design of population coverage studies
Because of differences in the design of the coverage studies over time, the rates in Table 11.1a, Table 11.1b, Table 11.1c and Table 11.1d are not strictly comparable. A list of the methodological changes made since 1976 is provided below. It is worth noting that the fundamentals of the RRC approach to measuring undercoverage have not changed much since the 1966 Census. A sample is selected from frames that cover the target population independent of the census. Census records are then checked (Reverse Record Check) to determine whether the sampled persons were actually enumerated. More changes were made to the overcoverage measurement. Multiple studies were carried out in 1991, 1996 and 2001. In 1996, the RRC scope was expanded to include overcoverage. In 2006, the RRC was no longer used to estimate overcoverage, and a new study was introduced to measure all overcoverage cases based on probabilistic and exact matches using name, date of birth and sex.
2016 Census coverage studies:
- For the RRC census frame, the stratification was based on the province of residence, which was updated using tax data. Also, a deceased stratum was determined prior to sample selection. These improvements made for a more efficient sample.
- An “administrative” household was created using tax data for each selected person from the RRC to make processing and tracing more efficient.
- The RRC non-response adjustment for untraced persons no longer uses the subsample. The adjustment is made within response homogeneity groups composed of persons with similar probabilities of being in the target population and responding to the survey, as estimated with available data for both respondents and non‑respondents. Since the non-response adjustment model was finalized after collection, the subsample that was used for the adjustment for untraced persons in previous RRCs was still sent to collection, but was not used. It will not be required for the next RRCs.
- A calibration was performed to adjust the weights from the census frame when a provincial sample contained too many or not enough enumerated or deceased persons. For the three territories, a calibration to the comparable number of enumerated persons was performed, like in previous RRCs, except it was done separately for six age–sex groups in each territory, rather than using a single overall calibration group for each of them, as had been done in the past.
- Hierarchical deterministic waves were used to form blocks for the probabilistic linkages for steps 1 and 2 of the COS to improve frame coverage.
- The linkage rules for steps 1 and 2 were expanded to identify as many potential overcoverage cases as possible.
- Although Step 3 (extension) of the COS was restricted to private household pairs in 2011, it was expanded to include the household pairs produced for each person pair created in steps 1 and 2 and for which one of the two households was in a collective dwelling.
- Instead of being created separately for each step, the groups of records that could represent the same person were created by combining steps 1, 2 and 3 of the COS to better account for cases of multiple overcoverage.
Like every RRC since 1996, the 2016 RRC did not estimate the number of persons missed on incompletely enumerated Indian reserves and Indian settlements. For more information on this subject, see Section 12.2.
2011 Census coverage studies:
- The 2011 RRC was very similar to the 2006 RRC. To make it more efficient, some changes were introduced, including improvements in the monster match program, more effective strategies for searching the census RDB, and the use of new birth frames.
- For the first time, the census frame sample weighting considered the overcoverage in the census frame.
- With automated methods, it was possible to use provincial and territorial parameters instead of national parameters to develop the COS frame.
2006 Census coverage studies:
For the RRC and the COS, the name field added to the 2006 Census RDB was used optimally in matching and searching. In addition:
- The measurement of overcoverage was restricted to the COS. The RRC methodology was subsequently changed so that not all cases were sent for field collection. Since 2006, the RRC has had a processing step that is carried out prior to collection to determine whether collection is required. The version of the census RDB used for the census coverage studies (CCS-RDB) was searched for the sampled persons using information from the sampling frames and various update sources, such as tax data. If the search located the sampled person in the CCS-RDB, collection was not required. The only exception was a sample of persons that had been located to collect data required for the non-response adjustment.
- The three coverage studies conducted in 2001 to measure overcoverage were replaced by the COS in 2006. The COS used a different methodology from the one used in previous overcoverage studies. Essentially, it employed a linkage technique based on surnames, given names, sex and date of birth and manual verification to measure overcoverage.
2001 Census coverage studies:
- The institutional component of the Collective Dwelling Study (CDS) was dropped, and overcoverage estimates for this population were produced by the RRC.
- The Dwelling Classification Study (DCS) replaced the Vacancy Check (VC), which was used in previous censuses to check the classification of dwellings that the enumerator had determined to be unoccupied. The DCS is an extension of the VC, which estimated the number of persons living in non-response dwellings.
1996 Census coverage studies:
- The 1996 RRC did not estimate the number of persons missed on incompletely enumerated Indian reserves.
- The Temporary Residents Study was cancelled because of concerns about data quality, and because it was recognized that the RRC would measure this type of undercoverage appropriately.
- First, a measure of overcoverage that was more comprehensive than the 1991 measure was produced by incorporating the Private Dwelling Study (PDS) into the RRC so that each sampled person could be identified as having been enumerated more than once. This approach resulted in an increase in the number of addresses to be processed where overcoverage could have occurred. Also, compared with 1991, the AMS was expanded substantially so that overcoverage could be determined not only for an enumeration area (EA), but also for a large region (Atlantic provinces, Quebec, Ontario, Western Canada and the territories).
1991 Census coverage studies:
- Non-permanent residents were included in the target population for the first time.
- Following experimental studies in 1986, the measurement of population overcoverage began in 1991. The results of three studies—the PDS, the CDS and the AMS—were combined to form a comprehensive estimate.
1986 Census coverage studies:
The rates shown in Table 11.1a and Table 11.1b for the 1986 Census differ from the results published in the User’s Guide to the Quality of 1986 Census Data: Coverage, which included revisions made after the 1986 publication, when incompletely enumerated reserves were considered missed. In the original 1986 publication, they were counted as “enumerated” since provincial data included an estimate of persons missed for Indian reserves.
1976 Census coverage studies:
Census data did not include an estimate from the VC of persons missed in dwellings incorrectly classified as unoccupied. The 1976 population undercoverage rate would have been 1.78% if it had included the results of the 1976 VC. There was no VC in the 1971 Census.
For more details on the history of coverage studies, see Dolson (2010).
- Date modified: